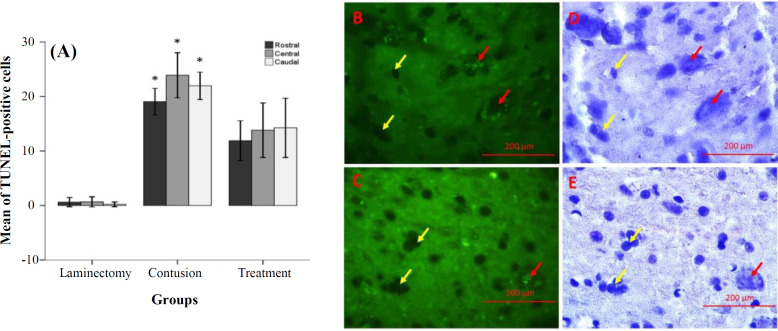
Fig. 1.
Effects of VPA on the inhibition of apoptosis 28 days post SCI (TUNEL assay, fluorescence microscope). (A) Bar graphs indicate the mean percentage of apoptotic cells in the experimental groups. Apoptotic cells were calculated in three (rostral, central and caudal) regions; (B and C) representative images of TUNEL staining (B, contusion and C, VPA); (D and E) counterstaining of the same field with hematoxylin. Red and yellow arrows show positive and negative cells, respectively. The bars indicate the mean ± SEM (*p ≤ 0.05 vs. VPA group; magnification 400×).

