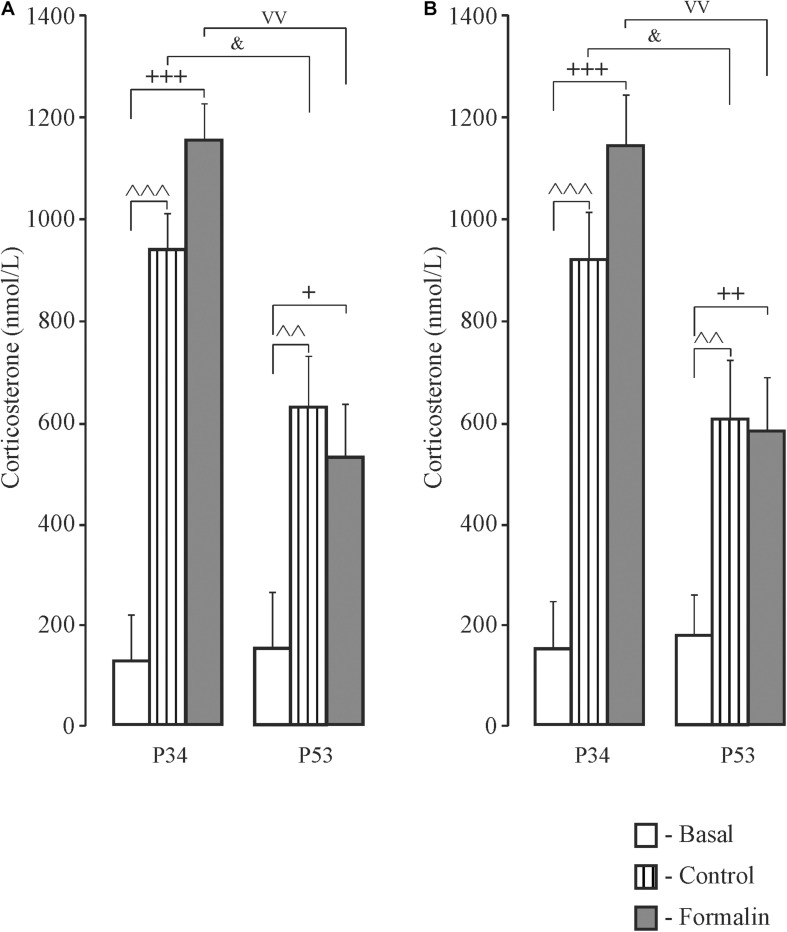
FIGURE 7.
Mean (±SEM) corticosterone levels in blood plasma in response to forced swimming in Control and Formalin rats at the age of P34 and P53 after testing in the Morris Water Maze. +p < 0.05, ++p < 0.01, +++p < 0.001, Formalin vs basal; ∧∧p < 0.01, ∧∧∧p < 0.001 Control vs basal; &p < 0.05, age differences between Control rats; vvp < 0.01, age differences between Formalin rats. The number of the rats in the groups corresponds to the number of rats in Figures 1, 2.

