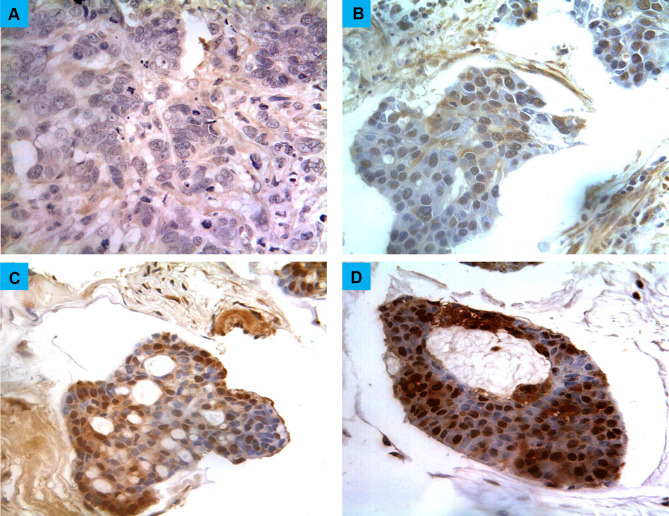
Figure 1.
Different scores of glypican-1 expression in breast cancers. (A) Score “negative” showing no expression in the tissue at all. (B) Score “low” showing expression less than 33% of cells, (C) score “moderate” showing expression in 34–66% of the cells, (D) score “strong” showing expression in more than 67% of the cells. Magnification (X400).

