Figure 1.
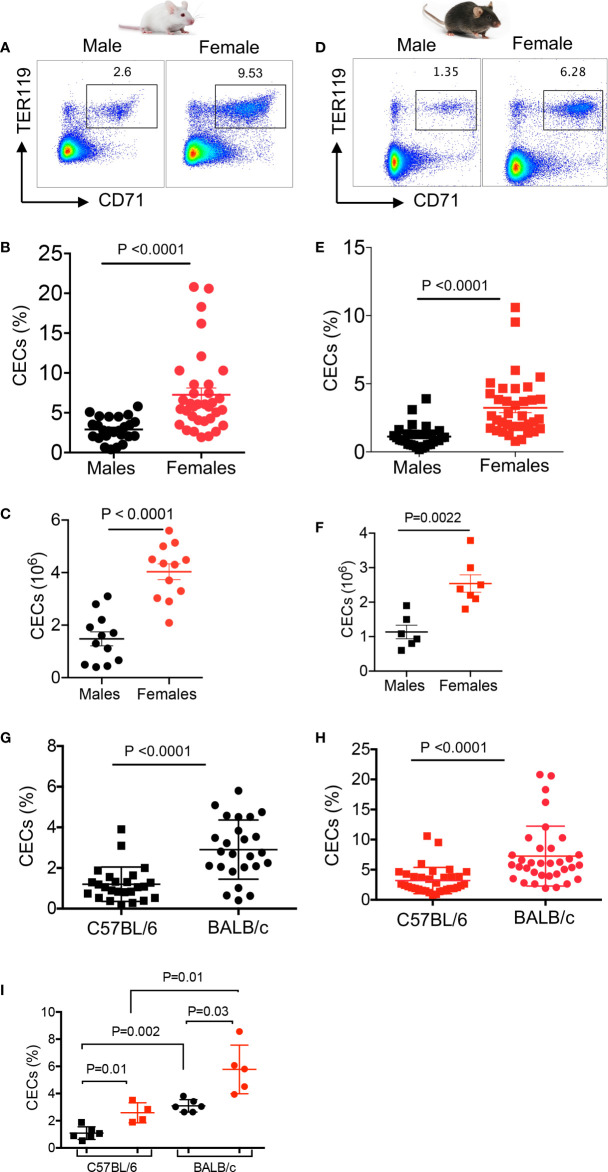
Higher frequency of CECs in female versus male mice. (A) Representative flow cytometry plots, (B) cumulative data of percentages, and (C) absolute numbers of CECs in spleens of BALB/c male and female mice. (D) Representative flow cytometry plots, (E) cumulative data of percentages, and (F) absolute numbers of CECs in spleens of C57BL/6 male and female mice. (G) Cumulative data comparing percentages of CECs in spleens of C57BL/6 and BALB/c male mice. (H) Cumulative data comparing percentages of CECs in spleens of C57BL/6 and BALB/c female mice. (I) Cumulative data comparing percentages of CECs in spleens of C57BL/6 male and female, and BALB/c male and female littermates at 8 weeks old. Each point represents data from an individual mouse, representative of at least three independent experiments. Bar, mean ± standard error.

