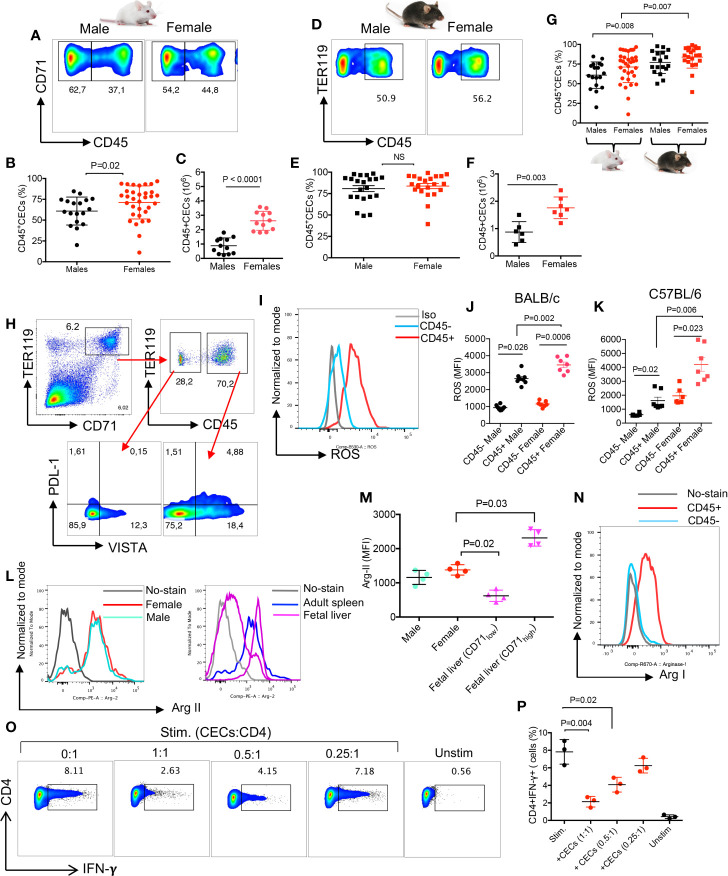
Figure 2.
CECs in adult mice express Arg II and ROS and suppress IFN-γ production by T cell. (A) Representative flow cytometry plots, (B) cumulative data of percentages, and (C) absolute numbers of CD45+/CD45-CECs in the spleen of BALB/c male and female mice. (D) Representative flow cytometry plots, (E) cumulative data of percentages, and (F) absolute numbers of CD45+/CD45−CECs in the spleen of C57BL/6 male and female mice. (G) Cumulative data comparing percentages of CD45+CECs in spleens of BALB/c and C57BL/6 male and female mice. (H) Representative flow cytometry plot of PDL-1 and VISTA expression in CD45− and CD45+ CECs from a female BALB/c mouse. (I) Histogram plots, and (J) cumulative data of the mean fluorescence intensity (MFI) for ROS expression in CD45− and CD45+CECs in male and female BALB/c mice. (K) Cumulative data of MFI for ROS expression in CD45+ BALB/c male and female C57BL/6 mice. (L) Histogram plots, and (M) cumulative data of Arg II expression (MFI) in total CECs in male versus female mice compared to fetal liver CD71low and CD71high CECs. (N) Representative histogram plot of Arg I expression in splenic CD45+ and CD45−CECs of a female BALB/c mouse. (O) Representative flow plots, and (P) cumulative data of IFN-γ production by CD4+ T cells in the absence or presence of CECs at different ratios (CECs : CD4) after stimulation with anti-CD3/CD28 antibodies for 6 h. Unstimulated (Unstim), stimulated with anti-CD3/CD28 (stim). Each point represents data from an individual mouse, representative of at least three independent experiments. Bar, mean ± standard error.

