Figure 6.
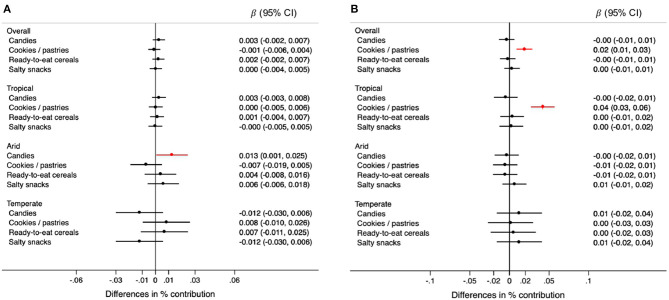
Differences in the percentage (95% CIs) of contribution of types of high-energy ultra-processed foods to the total energy intake for each 0.5 mm annual decrease in rainfall (A) and for each 0.1°C annual increase in temperature (B) during the 5-year period prior to the survey, overall and by climate region. Values were obtained using multivariable multilevel linear regression models adjusted for climate region (overall models) sex, age group, educational level, and rainfall or temperature, as appropriate.

