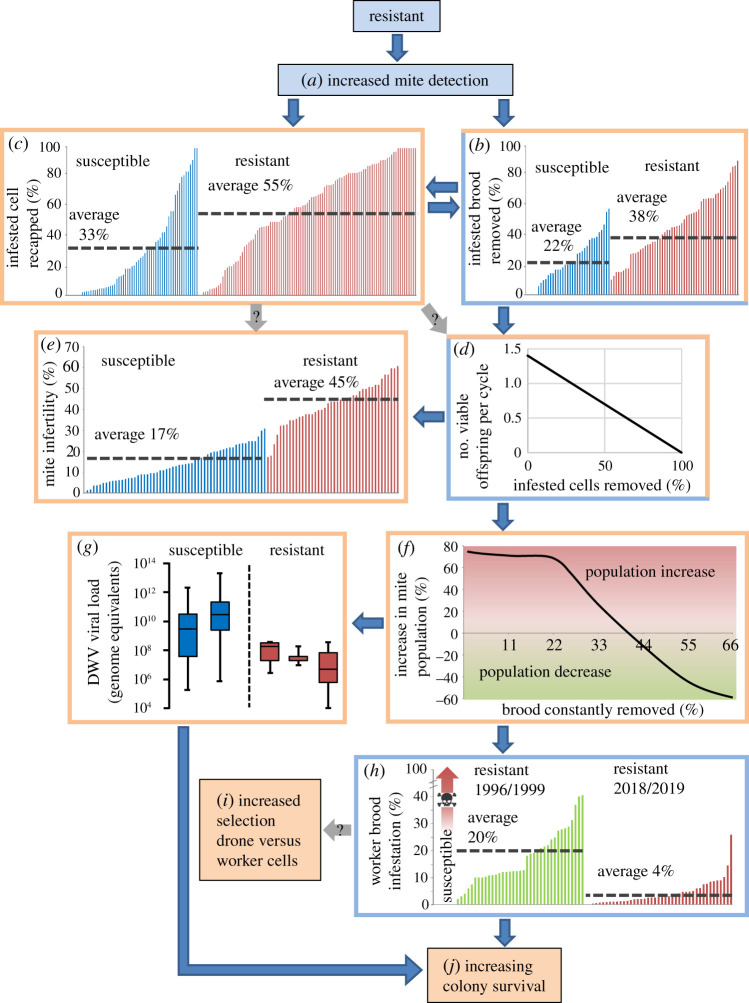
Figure 1.
A proposed framework for the development of Varroa resistance. Boxes in blue (a) or with a blue border (b,d,h) are ‘causes’ of the ‘effects’ that are indicated by boxes in orange (i,j) or with orange borders (b–g). All source data for each chart are available in the electronic supplementary material, tables S1–S8 and figure S1. Arrows with a question mark indicate possible links suggested in the literature. In box h, the red arrow indicates that in untreated, susceptible colonies Varroa infestations continuously rise until colony death. Deformed wing virus data in box g are adapted from [41] and discussed below. (Online version in colour.)

