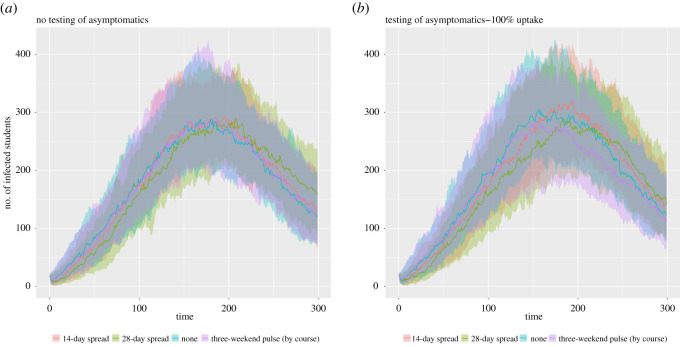
Figure 12.
Epidemiological outcomes among a student population given differing staggered return strategies to university using a stochastic compartmental model. Outputs are summarized from 10 simulations, with the lines representing the median number of symptomatic and asymptomatic students and the shaded areas showing the 2.5th and 97.5th percentiles. We display distributions corresponding to: (a) no testing of asymptomatics upon student return, (b) all asymptomatics are tested.

