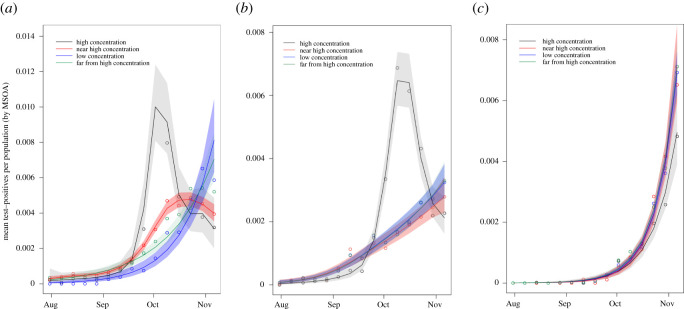
Figure 4.
Mean cases (represented as dots) per population in MSOAs categorized as high student concentration (black), near high student concentration (red), low student concentration (blue), and far from high student concentration (green) in each of (a) Manchester, (b) Birmingham and (c) Hull. Lines represent the smoothed weekly mean positive cases per population, shaded to cover the 95% confidence intervals of these estimates (details in appendix C).

