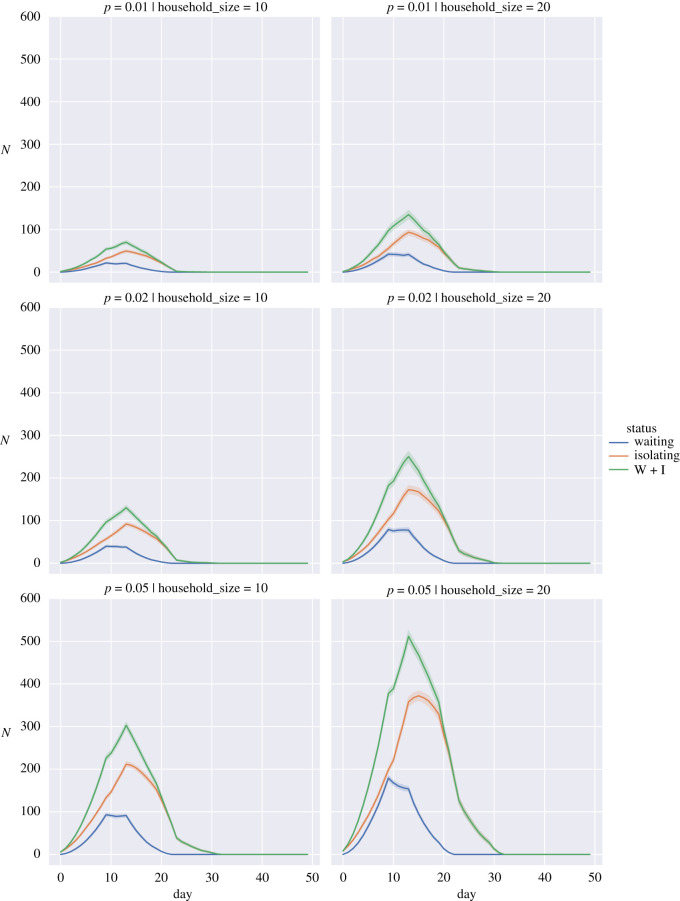
Figure 5.
Expected number of students in isolation against time for a return spread over 14 days when the probability of a returning student being infected, p, is 0.01 (top row), 0.02 (middle row) and 0.05 (bottom row) for household sizes of 10 individuals (left column) and 20 individuals (right column). Waiting (blue), Isolating (orange), W + I: Waiting + Isolating (green). Bands show 95% interval computed from 100 simulation runs.

