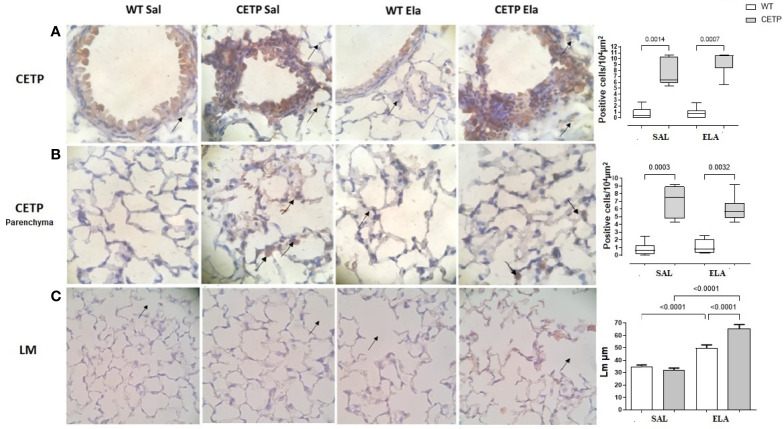
Figure 12.
Photomicrograph of stained slides for immunohistochemistry analysis of CETP in airways (A), lung parenchyma (B) and mean linear intercept (LM) by dot count of airway spreads (C) from WT and huCETP mice after elastase-induced emphysema (ELA) or saline (SAL). Representative images of photomicrographs: CETP magnification ×1,000 and (LM) ×400. Values expressed as median and percentiles 25 and 75 were analyzed by Kruskal–Wallis test with original FDR method of Benjamini and Hochberg post-test. The values were expressed as mean and standard deviation were analyzed by ANOVA with two-stage linear step-up procedure of Benjamini, Krieger, and Yekutieli post-test. p < 0.01, (n = 8).

