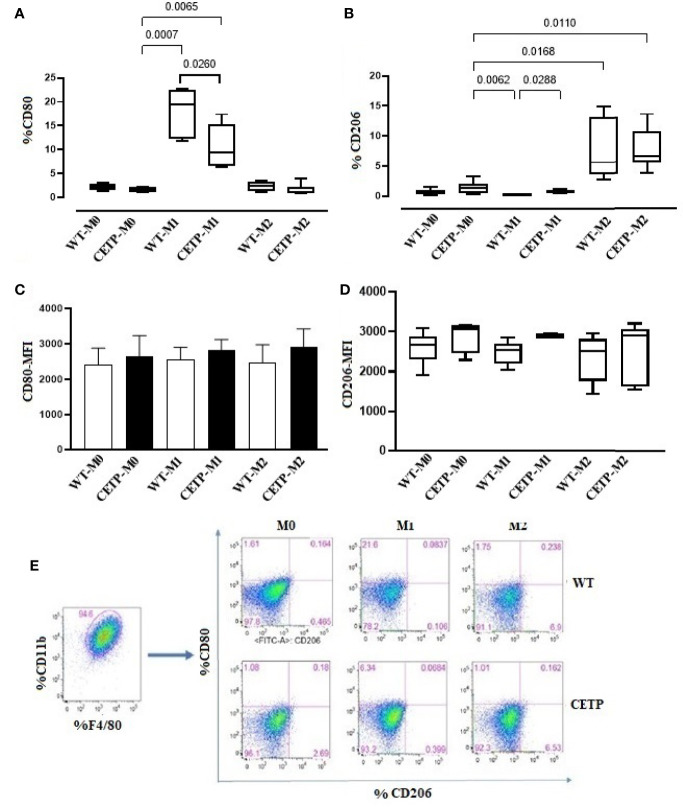
Figure 4.
Expression of cell surface markers associated with M1 (CD80) and M2 (CD206) from bone marrow-derived macrophages of WT and huCETP Tg mice. Expression of CD80 (A), CD206 (B), mean fluorescence intensity (MFI) of CD80 (C), MFI of CD206 (D), and representation of the gate strategy (E). Non-stimulated control cells (M0), stimulated M1 (5 ng/ml of IFNγ + 50 ng/ml of LPS) or M2 (10 ng/ml of IL-13 + IL-4) for 24 h. Basal fluorescence was determined using unlabeled cells, and compensation was performed with cells labeled with the respective fluorochromes on the FACSCanto II cytometer. In total, 100,000 events were analyzed. Values were expressed as mean and standard deviation. Values expressed as median and percentiles 25 and 75 were analyzed by Kruskal–Wallis test with original FDR method of Benjamini and Hochberg post-test. The values expressed as mean and standard deviation were analyzed by ANOVA with two-stage linear step-up procedure of Benjamini, Krieger, and Yekutieli post-test; (n = 3), P < 0.05.

