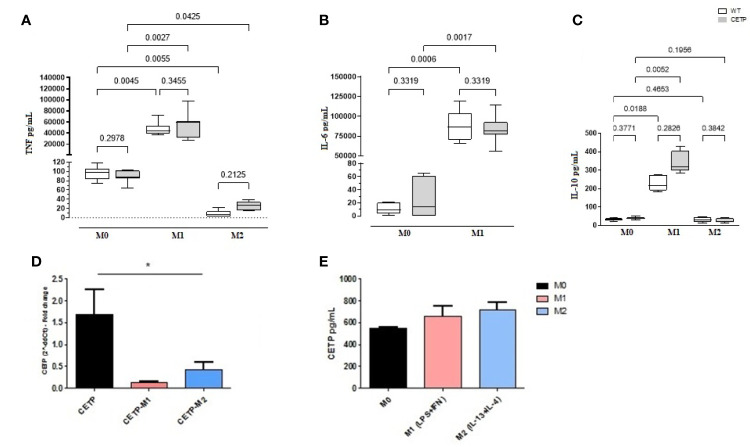
Figure 5.
Cytokine secretion, CETP expression, and secretion in cell culture medium. Bone marrow-derived macrophages from WT and huCETP mice, unpolarized (M0), or stimulated to M1 (5 ng/ml IFNγ + 50 ng/ml LPS) or to M2 (10 ng/ml IL-13 + IL-4) for 24 h. TNF-α (A), IL-6 (B), IL-10 (C), CETP mRNA expression in macrophages (D) and CETP secretion (E). Concentrations were determined by ELISA, and CETP expression was determined by RT-PCR. Values expressed as median and percentiles 25 and 75 were analyzed by Kruskal–Wallis test with original FDR method of Benjamini and Hochberg post-test. Values were expressed as mean and standard deviation analyzed by ANOVA with two-stage linear step-up procedure of Benjamini, Krieger, and Yekutieli post-test; (n = 5–8). P < 0.05. *M0 vs. M1 and M2.

