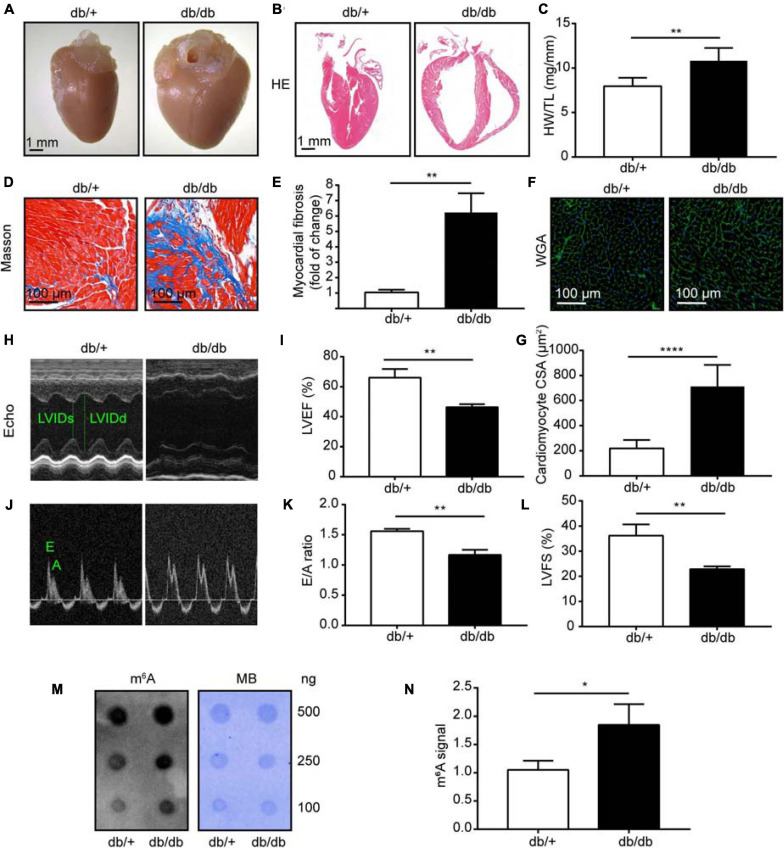
FIGURE 1.
Heart morphology and function were significantly changed in db/db (DCM) mice compared with those in normal control (NC) mice. (A) Representative images of hearts from DCM and NC mice. (B) Gross morphology of mouse hearts stained with hematoxylin and eosin (HE); scale bar, 1 mm. (C) Ratio of heart weight to tibia length. (D,E) Representative images of Masson trichrome stained (Masson) hearts and quantitative analysis of interstitial fibrosis; scale bar, 100 μm. (F,G) Representative images of wheat germ agglutinin staining (WGA) and quantitative analysis of cardiomyocyte cross-sectional area; scale bar, 100 μm. (H) Representative M-mode echocardiography images; left ventricular internal diameter in systole (LVIDs) and left ventricular internal diameter in diastole (LVIDd) are labeled. (I) LVEF, left ventricular ejection fraction. (J,K) Representative Doppler echocardiography images and E/A ratio. (L) LVFS, left ventricular fractional shortening. (M) Representative dot blot showing m6A levels in hearts from DCM and NC mice; MB, methylene blue staining. (N) Quantification of m6A levels in hearts from DCM and NC mice. DCM, diabetic cardiomyopathy group; NC, normal control group; n = 5. Data are presented as mean ± SEM; differences between two groups were analyzed using the Student’s t-test; ****P < 0.0001, **P < 0.01, *P < 0.05 vs. NC.

