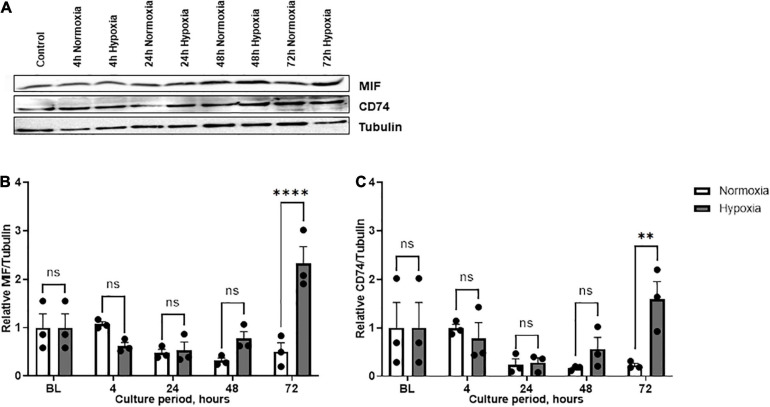
FIGURE 4.
Expression levels of MIF and CD74 under normoxia and hypoxia in patient group B. Group B included three adipose tissue specimens from chronic non-healing wounds, which exhibited high MIF secretion in the hypoxic culture of ASCs. Cells were cultured in growth medium at normoxic oxygen levels of 21% O2 or hypoxic oxygen levels of <1% O2. Cell lysates were obtained at indicated measuring points. Western blot analysis was performed and evaluated using the AIDA software. Tubulin was detected for total protein standardization. (A) Blots are representative of all Western blots performed to detect levels of MIF, CD74, and tubulin. Analyses were performed for three biological replicates, respectively (n = 3). The graphs display (B) relative MIF/tubulin and (C) relative CD74/tubulin normalized to the baseline value (BL) at 0 h, set to one. Data are mean values ± SEM (two-way ANOVA, Holm-Šídák’s multiple comparisons test, ∗∗p < 0.01, ****p < 0.0001).

