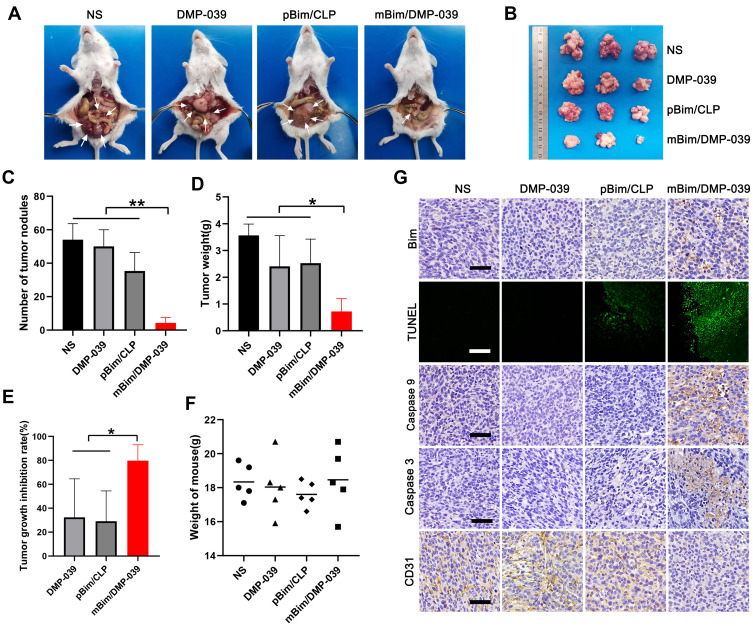
Figure 5.
The mBim/DMP-039 complex inhibited abdominal cavity metastatic tumor growth in vivo. (A) Images of representative mice from each treatment group. Tumor nodules (partial) are indicated by white arrows. (B) Tumor nodules harvested from each group. (C) The average number of tumor nodules in each group (**P < 0.01). (D) The average tumor weight in each group (*P < 0.05). (E) The tumor growth inhibition rate in each group (*P < 0.05). (F) The body weights of mice from each group before euthanasia. (G) Immunohistochemical evaluation of tumor tissues from each group and H&E analysis of main organ tissues from the mBim/DMP-039 complex group (scale bars: 50 μm).

