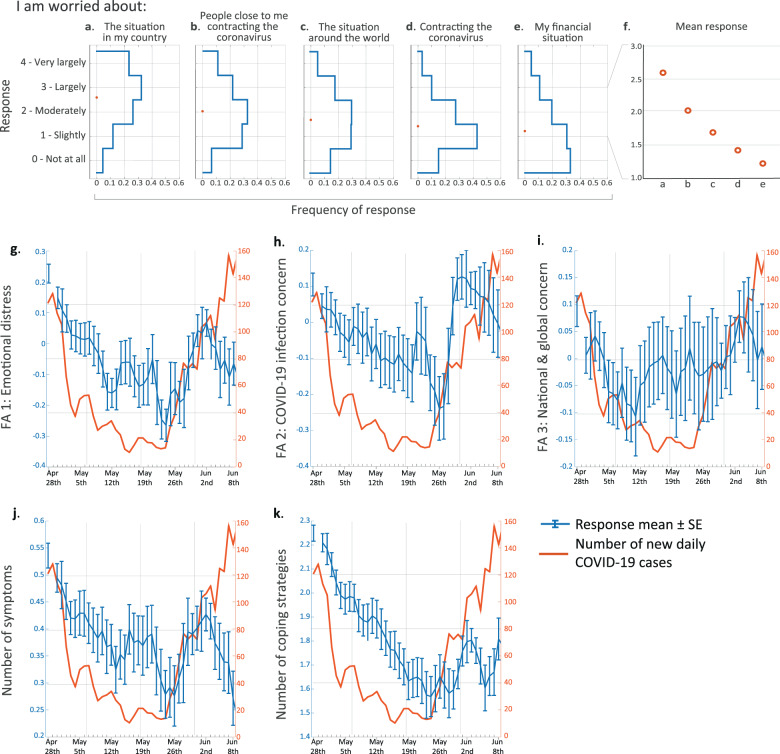
Fig. 1. Concerns induced by COVID-19 and their temporal dynamics.
a–e Blue lines represent distributions of participants’ first responses for specific reasons for worry among all respondents. Orange circles represent response means. f Zoomed-in view of the response means shown in a–e. Note that all five SE ranges are shorter than the circle diameters and were thus omitted from the plot. g–k Daily means and SE of g emotional distress, h COVID-19 infection concern, i national and global concern, j number of stress-related symptoms and k number of stress-coping strategies. Orange curves indicate the number of newly diagnosed COVID-19 patients as published by the Israeli Ministry of Health (www.health.gov.il). Kendall’s correlation coefficient with Bonferroni correction for multiple comparisons: g Tau = 0.03; p = 0.009; h Tau = 0.01; p = 0.733; i Tau = −0.01; p = 0.963; j Tau = 0.03; p = 0.0186; k Tau = 0.11; p < 1e−21.

