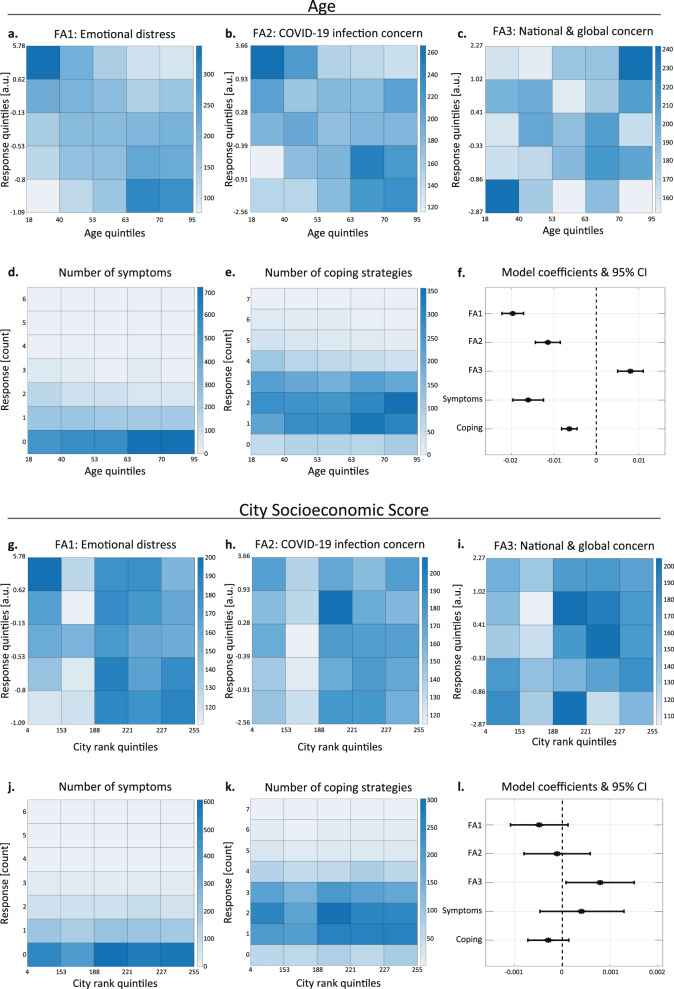
Fig. 3. Age and socioeconomic status correlate with reported distress.
a–e Heatmaps representing the frequency of responses for each age-response subgroup. Age and the three continuous response scores (a–c) were divided into five equally sized subgroups based on quintiles, while the (integer) number of symptoms and coping strategies were left as is (d, e; see ‘Methods’ section). Kendall’s correlation coefficient with Bonferroni correction for multiple comparisons: a n = 4641; Tau = −0.2; p < 1e−86; b n = 4641; Tau = −0.11; p < 1e−25; c n = 4641; Tau = 0.05; p = 8.38e−6; d n = 4728; Tau = −0.12; p < 1e−22; e n = 4728; Tau = −0.09; p < 1e−15. f Model coefficients and 95% confidence intervals for the association between age and responses on the five stress-related scales. g–k Heatmaps representing the frequency of responses for each city socioeconomic score (CSS)-response subgroup pair. CSS and the three continuous response scores (g–i) were divided into five equally sized subgroups based on quintiles, while the (integer) number of symptoms and stress-coping strategies (j, k) were left as is (see ‘Methods’ section). Kendall’s correlation coefficient with Bonferroni correction for multiple comparisons: g n = 4009; Tau = −0.041; p = 7.9e−4; h n = 4009; Tau = 0.02; p = 0.33; i n = 4009; Tau = 0.032; p = 0.0164; j n = 4081; Tau = 0.026; p = 0.191; k n = 4081; Tau = −0.033; p = 0.026. l Model coefficients and 95% confidence intervals for the association between CSS and responses on the five stress-related scales.

