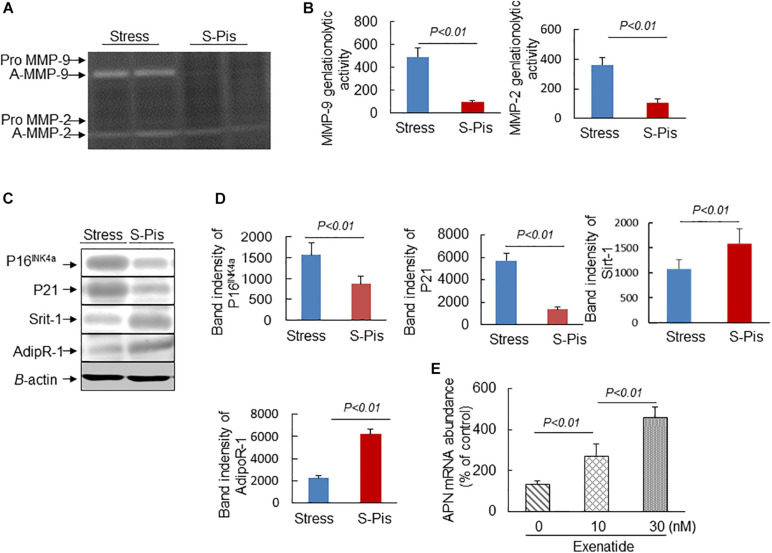
FIGURE 6.
Pitavastatin mitigated MMP-2/-9 expression/activity and targeted protein expressions in the aortic roots. (A,B) Representative gelatin zymography images and quantitative data for MMP-9 and MMP-2 activities. (C,D) Representative Western blot images and quantitative data show the protein expressions of P16INK4a, P21, Sirt-1, and Adip R-1. (E) Exenatide elevated APN gene expression in the stressed mouse inguinal adipose tissue-derived immature adipocytes. Values are presented as means ± SEM (n = 3–6). p < 0.05, p < 0.01 vs. Stress group by Student’s t-test and one-way ANOVA followed by Tukey post hoc tests.

