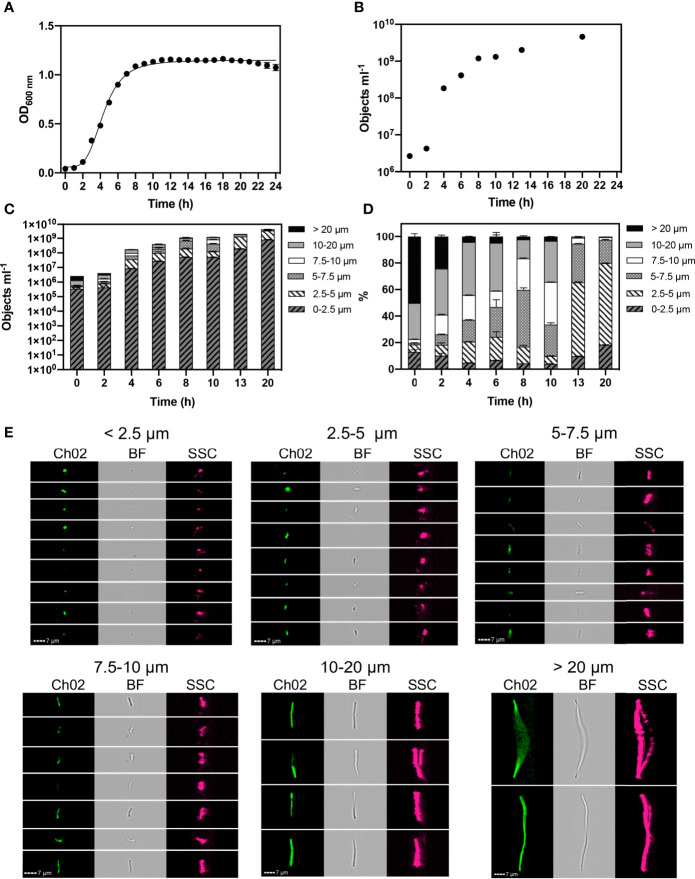
Figure 1.
Monitored phenotypes of Bacillus subtilis WB800N during 24 h growth. Hourly optical density (OD600) measurements were performed (A). Imaging Flow Cytometry was used to determine: cell concentration (objects ml-1) (B). Concentrations of different cell morphologies (as indicated by cell length) (C) and their relative proportions (D) are presented at selected time points. Exemplar cell images of autofluorescence (Ch02: 533/55 nm), brightfield (BF: 610/30 nm) and side scatter (SSC: 762/35 nm) within selected cell length intervals are shown (E). n= 3; error bars represent standard error of the mean.

