Figure 2.
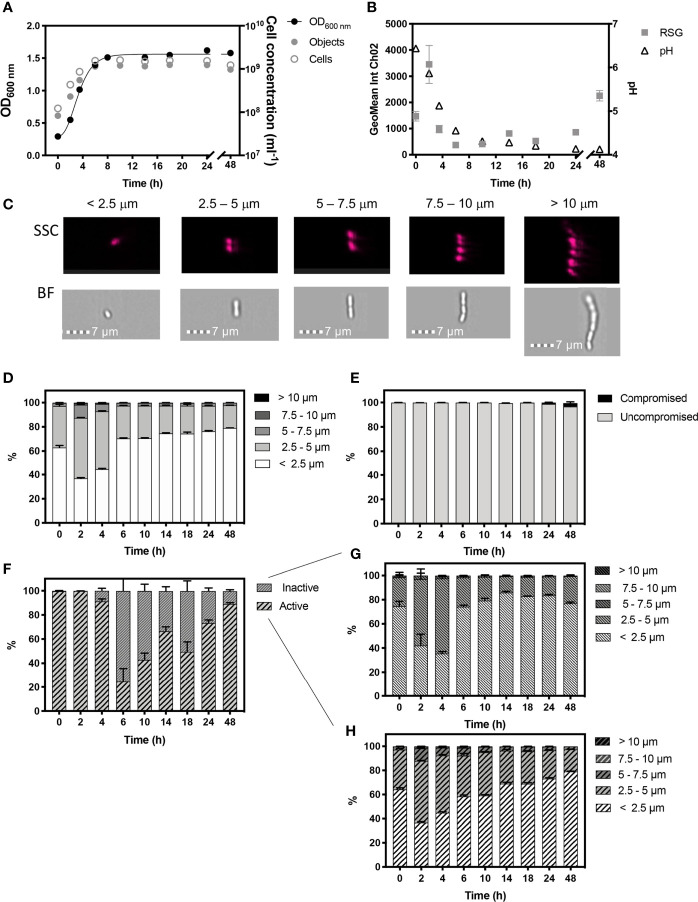
Monitored phenotypes of Lactiplantibacillus plantarum WCFS1 during 48 h growth. Measurements of Optical density (OD600) are plotted against IFC determined cell concentrations displayed as objects (ml-1) and cells (ml-1) (A). Cells ml-1 was calculated via normalization of object concentration by cell size and used as a proxy for biomass. The geometric mean of redox sensor green (RSG), indicative of metabolism, was determined from Channel 2 (Ch02: 533/55 nm) intensity and is plotted alongside media pH (B). Cell phenotypes were characterised by cell length, determined by brightfield (BF) and side scatter (SSC) properties (C). Proportions of cell length during growth are shown (D). The proportion of cells with compromised and uncompromised cell membranes, was tracked using propidium iodine and determined by red fluorescence intensity (Ch05: 702/85 nm), normalised for cell area (E). Proportions of metabolically ‘active’ and ‘inactive’ cells are presented (F) and cell lengths of ‘inactive’ (G) and ‘active’ (H) cells within the uncompromised population are shown. n =5; error bars represent standard error of the mean.

