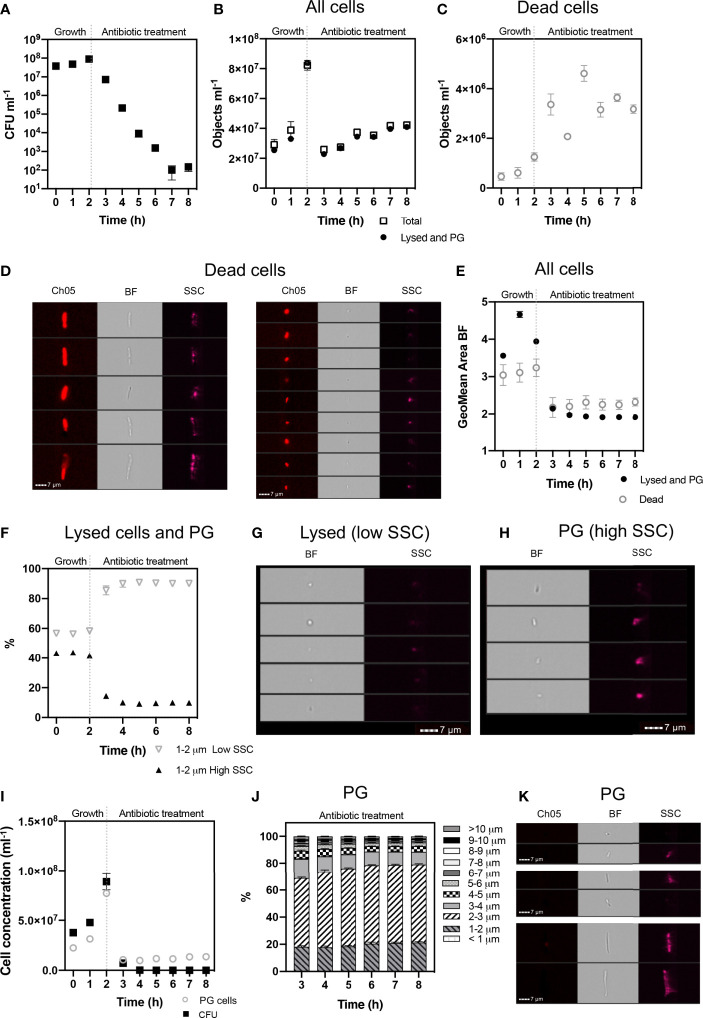
Figure 4.
Cell phenotypes of E. coli during 2 h exponential growth and 6 h antibiotic treatment. The growth of viable cells was monitored via colony forming unit (CFU) counts (A). IFC was used to detect cell concentrations (objects ml-1) of the ‘Total’ population and ‘Lysed and Persister Group’ (PG) cells (i.e., persister cells and VBNC) (B). Concentrations of ‘Dead’ cells (C) were identified based on their high PI signal (Ch05: 702/85 nm) and pitted morphology (D). Dead cells were excluded from ‘Total’ cells, to determine ‘Lysed and PG’ cells. The geometric mean area of cells demonstrates a decrease in cell size following antibiotic treatment (E). Lysed cells were determined as having low side scatter (SSC) intensity and increased on the application of antibiotic (F). Brightfield (BF) and SSC images demonstrate the low SSC cells (Lysed) have a compromised cell structure, consisting of small spherical particulate (G), indicative of lysed debris. In comparison, high SSC (PG) cells demonstrate a rod-shaped structure, highlighting cell integrity (H). The gating strategy applied for isolating lysed cells from PG cells, is supported by statistically significant relationship between CFU counts and PG cell concentrations (I) (Spearman’s Rank: p < 0.05). Size proportions of the PG cells are shown in 1 µm intervals (J) and exemplar cells from the PG population at 8 h are shown (K). n = 4; error bars represent standard error of the mean.

