Figure 6.
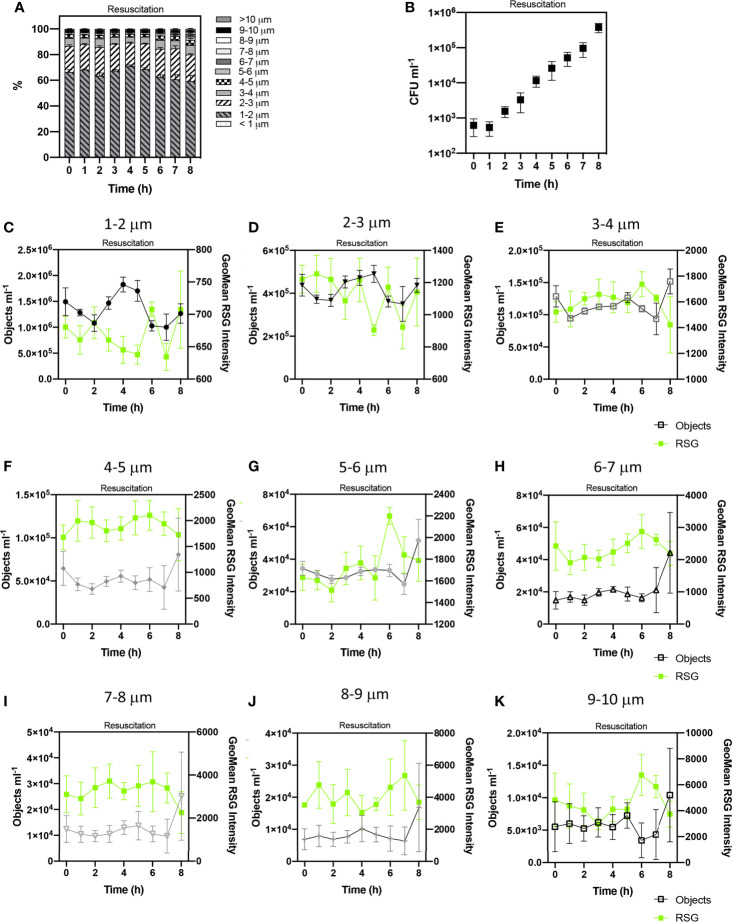
Tracking the revival of E. coli persister cells after antibiotic exposure. Proportions of cell sizes within the persister group (PG) (A). The growth of viable cells was monitored via colony forming unit (CFU) counts (B). Concentrations of cell sizes (at 1 µm cell length intervals) and Geometric mean intensity of RSG for these size intervals over 8 h of resuscitation (C–K). Changes in these concentrations reflect cell growth and therefore the determination of persister cells. n = 5; error bars represent standard error of the mean.

