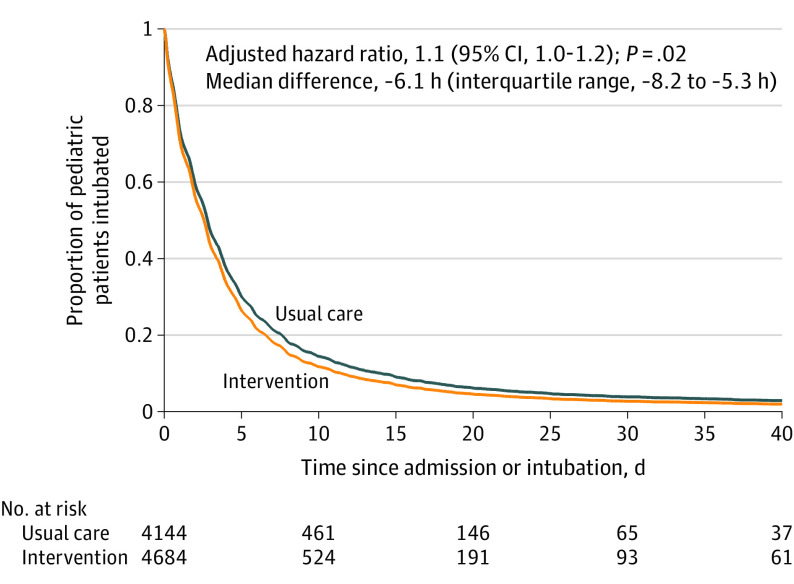
Figure 2. Probability and Time to Successful Extubation by Observation Period in the Prolonged Invasive Ventilation Cohort.
The hazard ratio (95% CI) and the median difference (interquartile range) were adjusted for cluster and calendar time. Patients were observed from initiation of ventilation until the first successful extubation (defined as still breathing spontaneously for 48 hours after extubation). The curves on the graph were created using adjusted data. The No. at risk are the absolute patient numbers and therefore will not match precisely with the covariate-adjusted curve.

