
Figure 8.
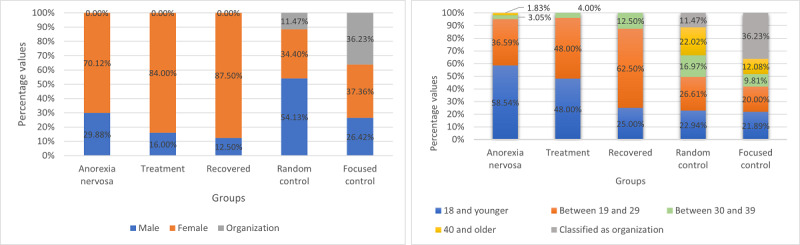
Composition of the anorexia nervosa, treatment, recovered, and control user groups according to gender and age. Each age and gender subgroup is represented by a color.
Official websites use .gov
A
.gov website belongs to an official
government organization in the United States.
Secure .gov websites use HTTPS
A lock (
) or https:// means you've safely
connected to the .gov website. Share sensitive
information only on official, secure websites.
Composition of the anorexia nervosa, treatment, recovered, and control user groups according to gender and age. Each age and gender subgroup is represented by a color.