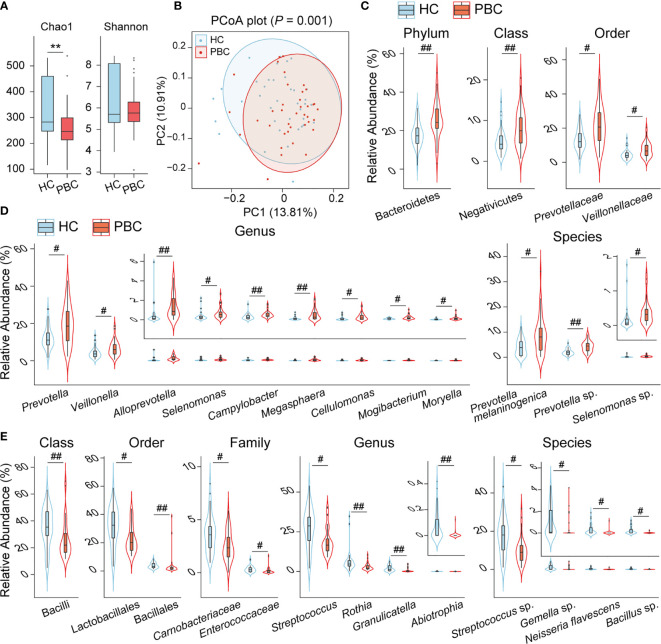
Figure 1.
The salivary microbiota of PBC patients is distinct from that of HC subjects. (A) Box plot and distribution of the Chao1 index and Shannon index. (B) PCoA plot based on the unweighted UniFrac distance. (C) Phyla, classes, and orders enriched in PBC saliva. (D) Genera and species enriched in PBC saliva. (E) Classes, orders, families, genera and species depleted in PBC saliva. **P < 0.01; # P adj < 0.05; ## P adj < 0.01.

