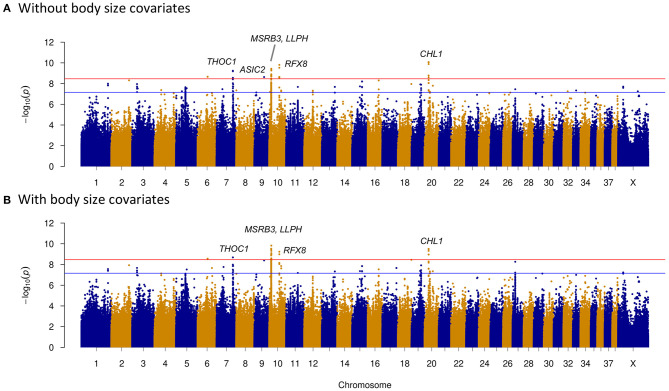
Figure 2.
Manhattan plots of herding behavior genome-wide association study (GWAS). The plots show the –log10 p-values for all variants of GWAS. Red horizontal line represents the Bonferroni genome-wide significance threshold, and blue horizontal line indicates suggestive significance threshold. (A) Without including body size as a covariate. Candidate genes around significantly associated sites (above the Bonferroni threshold) were marked with red color in the Manhattan plot; they are THOC1 of CFA7; ASIC2 of CFA9; MSRB3, LLPH, and RFX8 of CFA10; and CHL1 of CFA20. (B) Including body size as a covariate. Candidate genes (THOC1, MSRB3, LLPH, RFX8, and CHL1) were marked in the plot.

