
FIGURE 2.
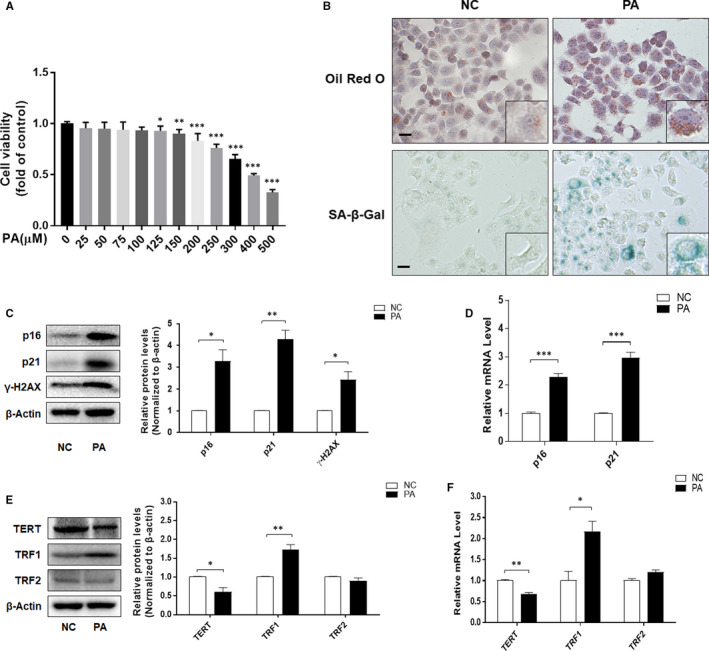
PA promoted cellular senescence of human hepatocyte LO2 cells. A, Cell Count Kit‐8 analysis of the cell viability of LO2 cells. Significance: ∗ P <.05 versus NC, ∗∗ P <.01 versus NC, ∗∗∗ P <.001 versus NC. B, Representative image of Oil Red O and SA‐β‐gal staining of LO2 cells under the indicated conditions. Scale bar, 100 μm. C, E, Western blot analyses of p16, p21, γ‐H2AX, TERT, TRF1 and TRF2 in LO2 cells. Data are represented as mean ±SEM. Significance: ∗ P <.05 versus NC, ∗∗ P <.01 versus NC. D, F, qRT‐PCR analyses of p16, p21, TERT, TRF1 and TRF2 in LO2 cells. Data are represented as mean ±SEM. Significance: ∗ P <.05 versus NC, ∗∗ P <.01 versus NC, ∗∗∗ P <.001 versus NC