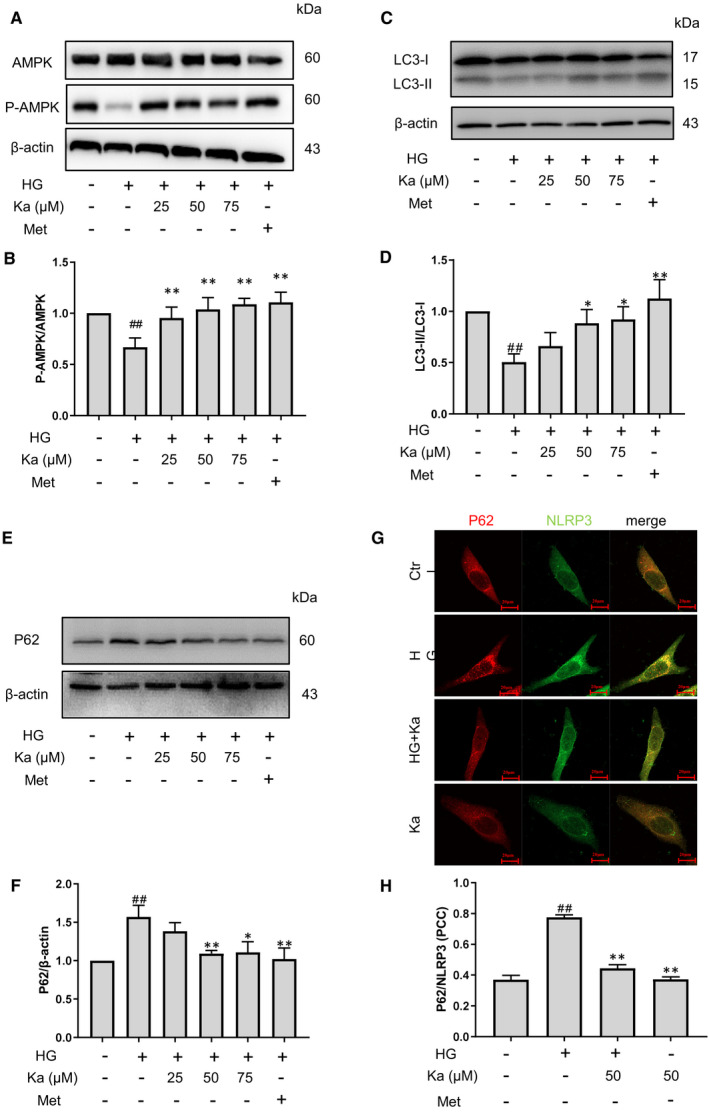
FIGURE 5.

Recovery of high glucose‐induced decrease of autophagy in endothelial cells by kakonein (A) and (B) Analysis and summary of high glucose‐induced AMPK expression through Western blot (n = 4). (C) and (D) Analysis and summary of high glucose‐induced LC3 expression through Western blot (n = 4). (E) and (F) Analysis and summary of high glucose‐induced P62 expression through Western blot (n = 4). (G) Fluorescence indicating the effect of kakonein on NLRP3 (green) and P62 (red) co‐localization in endothelial cells. (H) Quantitative analysis of the co‐localization of NLRP3 with P62 (n = 4). # P < .05 and ## P < .01 compared with the control. *P < .05 and **P < .01 kakonein or metformin hydrochloride compared with HG
