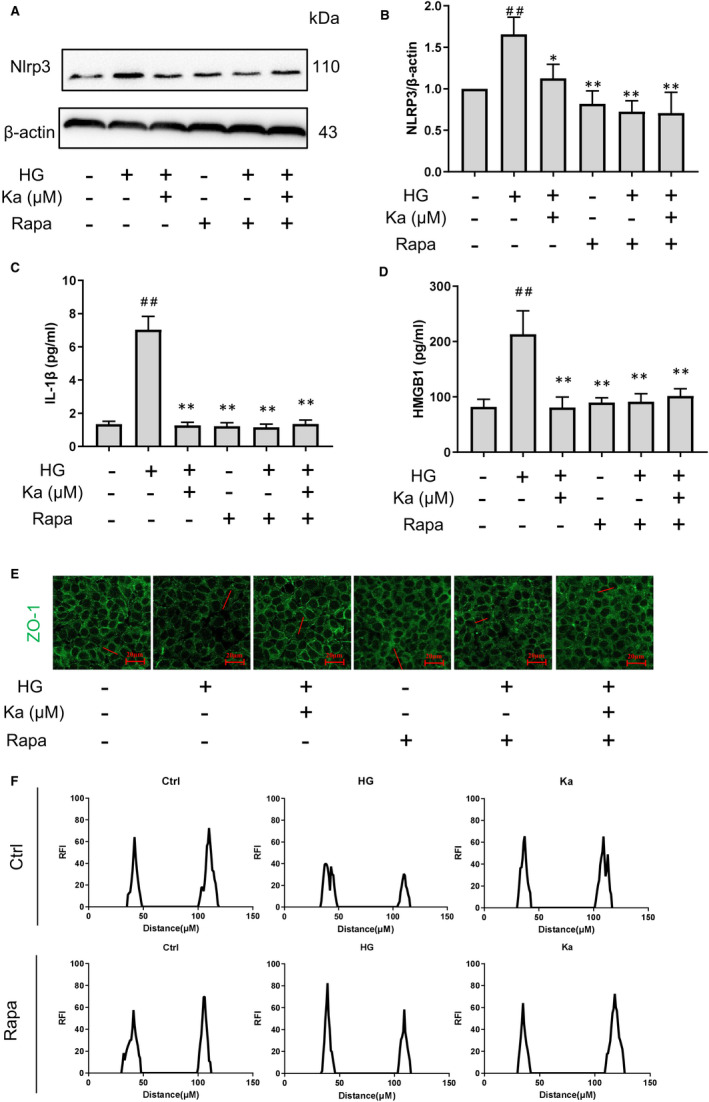
FIGURE 6.

Validation of the therapeutic effect of kakonein in HG‐induced endothelial cell dysfunction through the upregulation of autophagy. (A) and (B) Analysis and summary of NLRP3 expression after rapamycin intervention through Western blot (n = 4). (C) IL‐1β content in supernatant was detected by ELISA kit (n = 4). (D) HMBG1 content in supernatant was detected by ELISA kit (n = 4). (E) Immunofluorescence representative images indicating the effects of rapamycin and kakonein on ZO‐1 under high‐glucose stimulation (n = 4). (F) The expression of ZO‐1 was represented by RFI. # P < .05 compared with the control. **P < .01 and *P < .05 compared with HG
