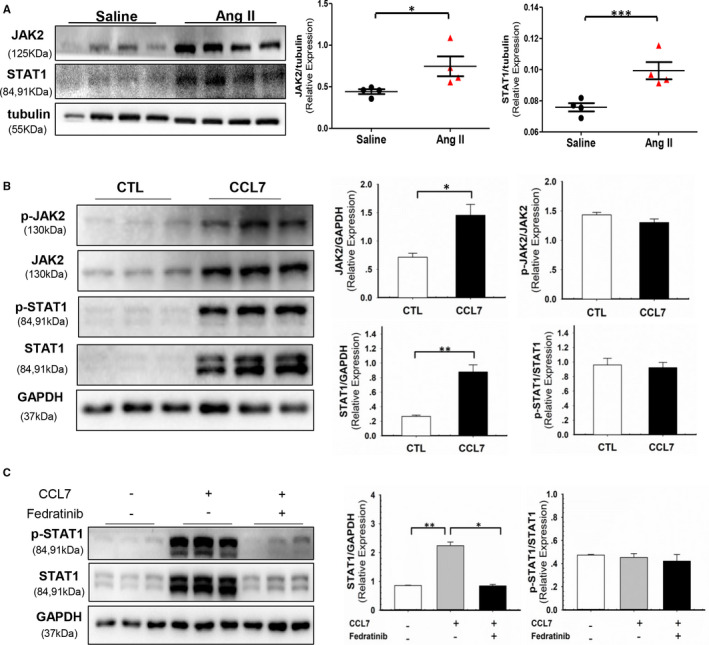
FIGURE 4.

CCL7‐activated JAK2/STAT1 signal in macrophages. (A) Protein abundance of JAK2 and STAT1 in abdominal aortas of saline (n = 4) and Ang II‐infused (n = 4) mice. (B) Protein abundance of JAK2, p‐JAK2, STAT1, p‐STAT1 and p‐JAK2/JAK2, p‐STAT1/STAT1 ratio in BMDMs incubated with rmCCL7 (100 ng/ml). (C) Protein abundance of STAT1, p‐STAT1 and p‐STAT1/STAT1 ratio in BMDM incubated with rmCCL7(100 ng/ml) and pre‐treated 1 hour with JAK2 inhibitor Fedratinib (1 μM). Values were represented as mean ± SEM; Student's t test was used for data analysis in (A, B). One Way ANOVA was used for data analysis in(C). *P < .05; **P < .01; ***P < .001, respectively
