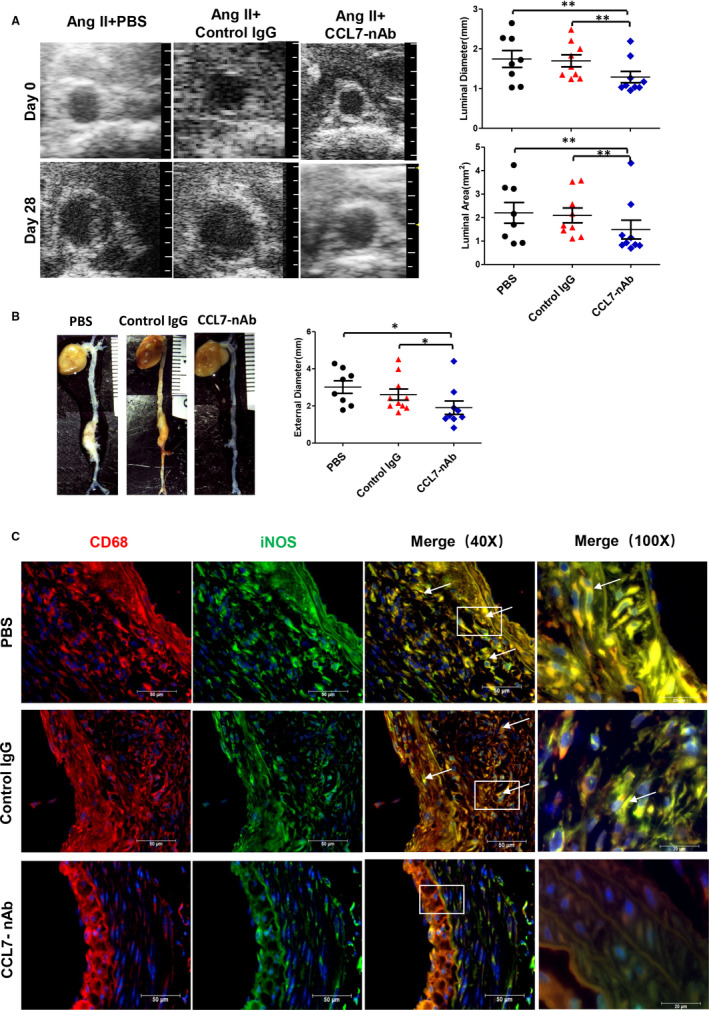
FIGURE 6.

CCL7 blockade attenuated Ang II‐induced AAA. (A) Representative images of abdominal aortas measured by ultrasound including maximum abdominal aorta diameter (luminal diameter) and maximum abdominal aorta area (luminal area) of PBS (n = 10), Control IgG (n = 10) and CCL7‐nAb group (n = 10). A grid on the scale represented 0.5 mm. (B) Ex vivo maximum abdominal aorta diameter (external diameter) of PBS, Control IgG and CCL7‐nAb group. A grid on the scale represented 1 mm. (C) Representative images of M1 macrophage infiltration in abdominal aortas of PBS (n = 10), Control IgG (n = 10) and CCL7‐nAb group (n = 10) as revealed by CD68 and iNOS Immunofluorescence co‐staining. Scale bars represented 50 μm. Each plot represented 3 independent experiments. Values were represented as mean ±SEM; One Way ANOVA was used for data analysis in (A‐B). *P < .05; **P < .01; ***P < .001, respectively. White arrows (C) indicated CD68 and iNOS‐positive location
