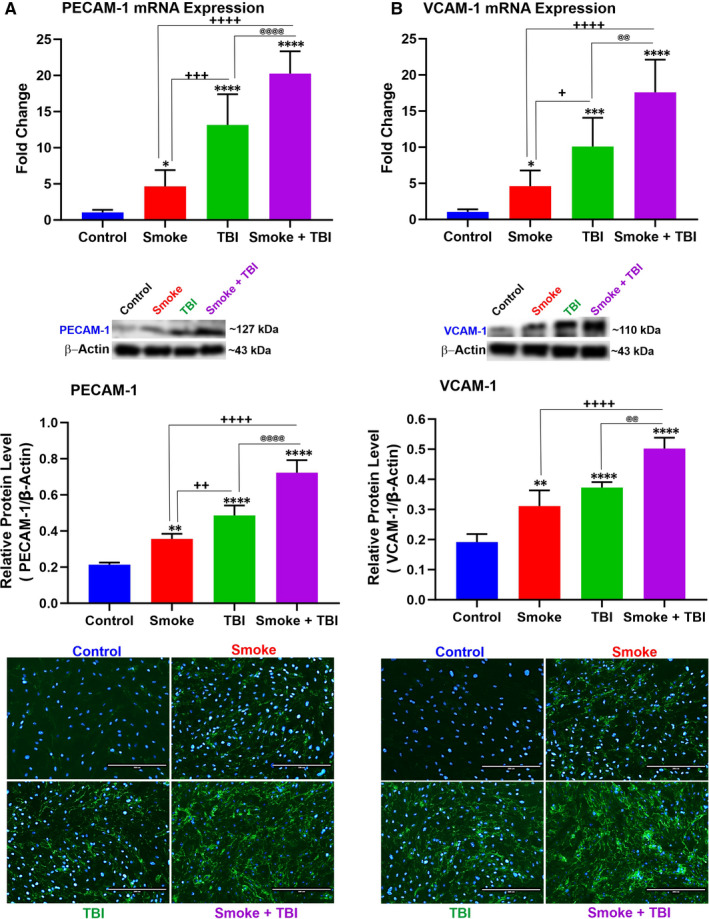
FIGURE 3.

TS exposure enhances the expression levels of inflammatory adhesion molecules PECAM‐1 and VCAM‐1 in BBB endothelial cells undergoing traumatic injury simulation. TS exposure caused up‐regulation of PECAM‐1 expression and further enhanced by traumatic injury as shown by (A) WB, quantitative RT‐PCR and immunofluorescence analyses. B, A similar parallel trend was observed for VCAM‐1. Please note that the reported β‐actin band for PECAM‐1 (Figure 3A) is the same as that shown for Cld‐5 (Figure 6B) since these proteins were run in the same group (Group 2). Similarly, the reported β‐actin band for VECAM‐1 (Figure 3B) is the same as that shown for NQO‐1 (Figure 5C) and Ocln (Figure 6C) since these proteins were also run in the same group (Group 3) as stated in the method section. n = 6 biological replicates, *P < .05, **P < .01, ***P < .001, ****P < .0001 vs control. + P < .05, ++ P < .01, +++ P < .001, ++++ P < .0001 vs smoked group. @ P < .05, @@ P < .01, @@@ P < .001, @@@@ P < .0001 vs TBI‐induced group. WB analyses express protein/β‐actin ratios
