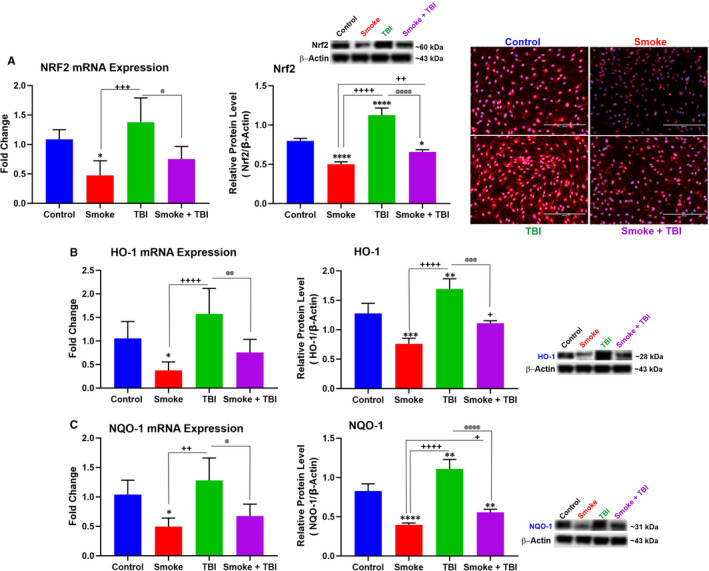
FIGURE 5.

TS exposure down‐regulated Nrf2 and its downstream detoxifying effector molecules HO‐1 and NQO‐1 in BBB endothelial cells following traumatic injury simulation. A, Western blotting, quantitative RT‐PCR and (B) immunofluorescence imaging analyses emphasized the role of chronic TS exposure in Nrf2 expression level and synergism with TBI. Alternations in Nrf2 expression levels were paralleled by corresponding changes of (B) HO‐1 and (C) NQO‐1. Please note that the reported β‐actin band for Nrf2 (Figure 5A) is the same as that shown for OH‐1 (Figure 5B) since these proteins were run in the same group (Group 1). Similarly, the reported β‐actin band for NQO‐1 (Figure 5C) is the same as that shown for VECAM‐1 (Figure 3B) and Ocln (Figure 6C) since these proteins were also run in the same group (Group 3) as stated in the method section. n = 6 biological replicates, *P < .05, **P < .01, ***P < .001, ****P < .0001 vs control. + P < .05, ++ P < .01, +++ P < .001, ++++ P < .0001 vs smoked group. @ P < .05, @@ P < .01, @@@ P < .001, @@@@ P < .0001 vs TBI‐induced group. WB analyses express protein/β‐actin ratios
