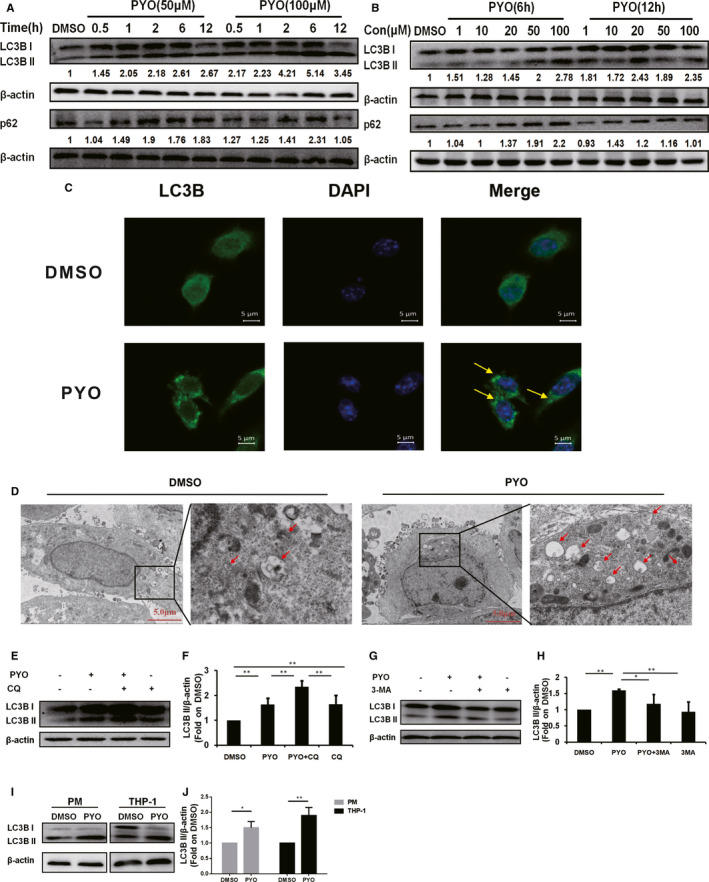
FIGURE 1.

Pyocyanin induces autophagy in macrophages. (A) Western blot showing LC3B II and p62 protein in the RAW 264.7 cells treated with PYO (50 μM or 100 μM) at indicated time‐points or (B) treated with PYO (6 h or 12 h) at the indicated concentration. (C) Confocal microscopy images displaying the amount of intracellular LC3B puncta (green fluorescence, 630x) upon PYO (50 μM, 6 h) or DMSO treatment. The nucleus was stained using DAPI (blue fluorescence, 630x), scale bar = 5 μm. (D) The transmission electron microscopic images showing the formation of autophagosomes and autophagolysosomes upon PYO (50 μM, 6 h) or DMSO treatment. The right panel (6000x) is an enlarged image of the black box in the left panel (1500x), and arrows denote autophagosomes or autophagolysosomes, scale bar = 5 μm. (E) Western blot analysis showing LC3B II in RAW 264.7 cells upon PYO stimulation with or without CQ (1 μM), and (F) densitometric analysis showing relative expression normalized to the DMSO group. (G) Western blot analysis showing LC3B II in RAW 264.7 cells upon PYO stimulation with or without 3‐MA (2 mM), and (H) the densitometric analysis showing relative expression normalized by that of the DMSO group. (I) Western blot analysis showing LC3B II in PM and THP‐1 cells upon PYO (50 μM, 6 h) or DMSO treatment, and (J) the densitometric analysis showing relative expression normalized to the DMSO group. Data are expressed as mean ± SD, *P < 0.05 and **P < 0.01, n = 3, and DMSO is the control
