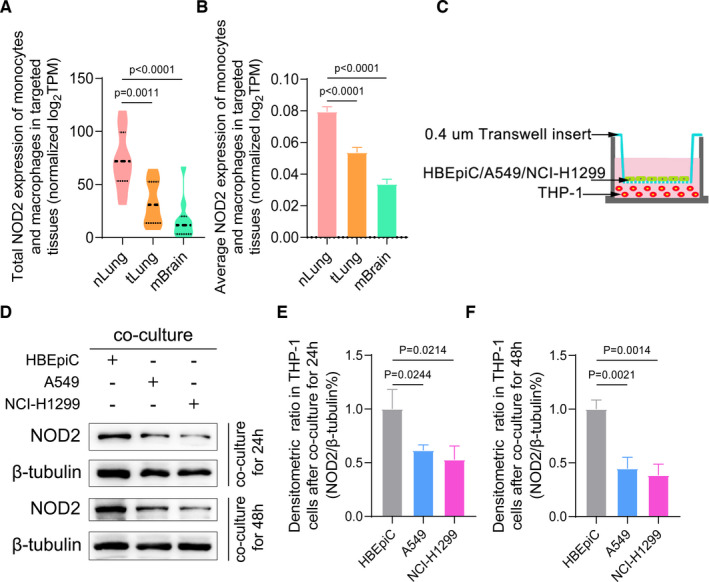
FIGURE 6.

Decreased NOD2 expressions in TAMs were induced by LUAD cells. (A) Total NOD2 expression values of mo‐Mac in nLung, tLung and mBrain samples of GEO cohort. (B) Average NOD2 expression values of mo‐Mac in nLung, tLung and mBrain samples of GEO cohort (mean + SEM). (C) The schemes of the in vitro cellular co‐cultured experiment. (D) The level of NOD2 expressions in the co‐culture system was tested by Western blot. Representative pictures are shown. (E and F): The average densitometric values of NOD2 expressions are shown by histograms normalized to the levels of β‐tubulin (mean + SD). Abbreviations: mBrain, metastatic brain tissue samples; nLung, distant normal lung samples; SD, standard deviation; SEM, standard error of mean; tLung, primary tumour samples; TPM, transcripts per million
