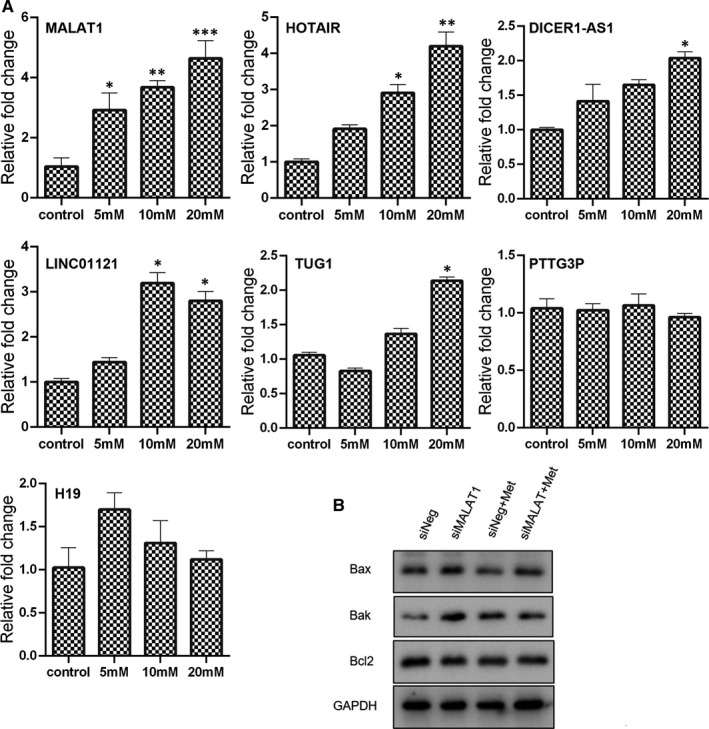
FIGURE 5.

Role of lncRNA in metformin‐treated cells. (A) Expression of lncRNA in metformin‐treated cells as measured by qPCR (mean ± SEM of duplicate experiments). *P < .05 vs control, **P < .01 vs control and ***P < .001 vs control. (B) Expression of apoptosis‐associated genes in cells treated with metformin (20 mmol/L) in combination with MALAT1 knock‐down as determined by Western blot analysis. Grayscale analysis for Western blot could be seen in Figure S5. siNeg, cells treated with negative control siRNA; siMALAT1, cells treated with MALAT1 siRNA; siNeg+Met, cells treated with negative control siRNA in combination with metformin; siMALAT+Met, cells treated with MALAT1 siRNA in combination with metformin
