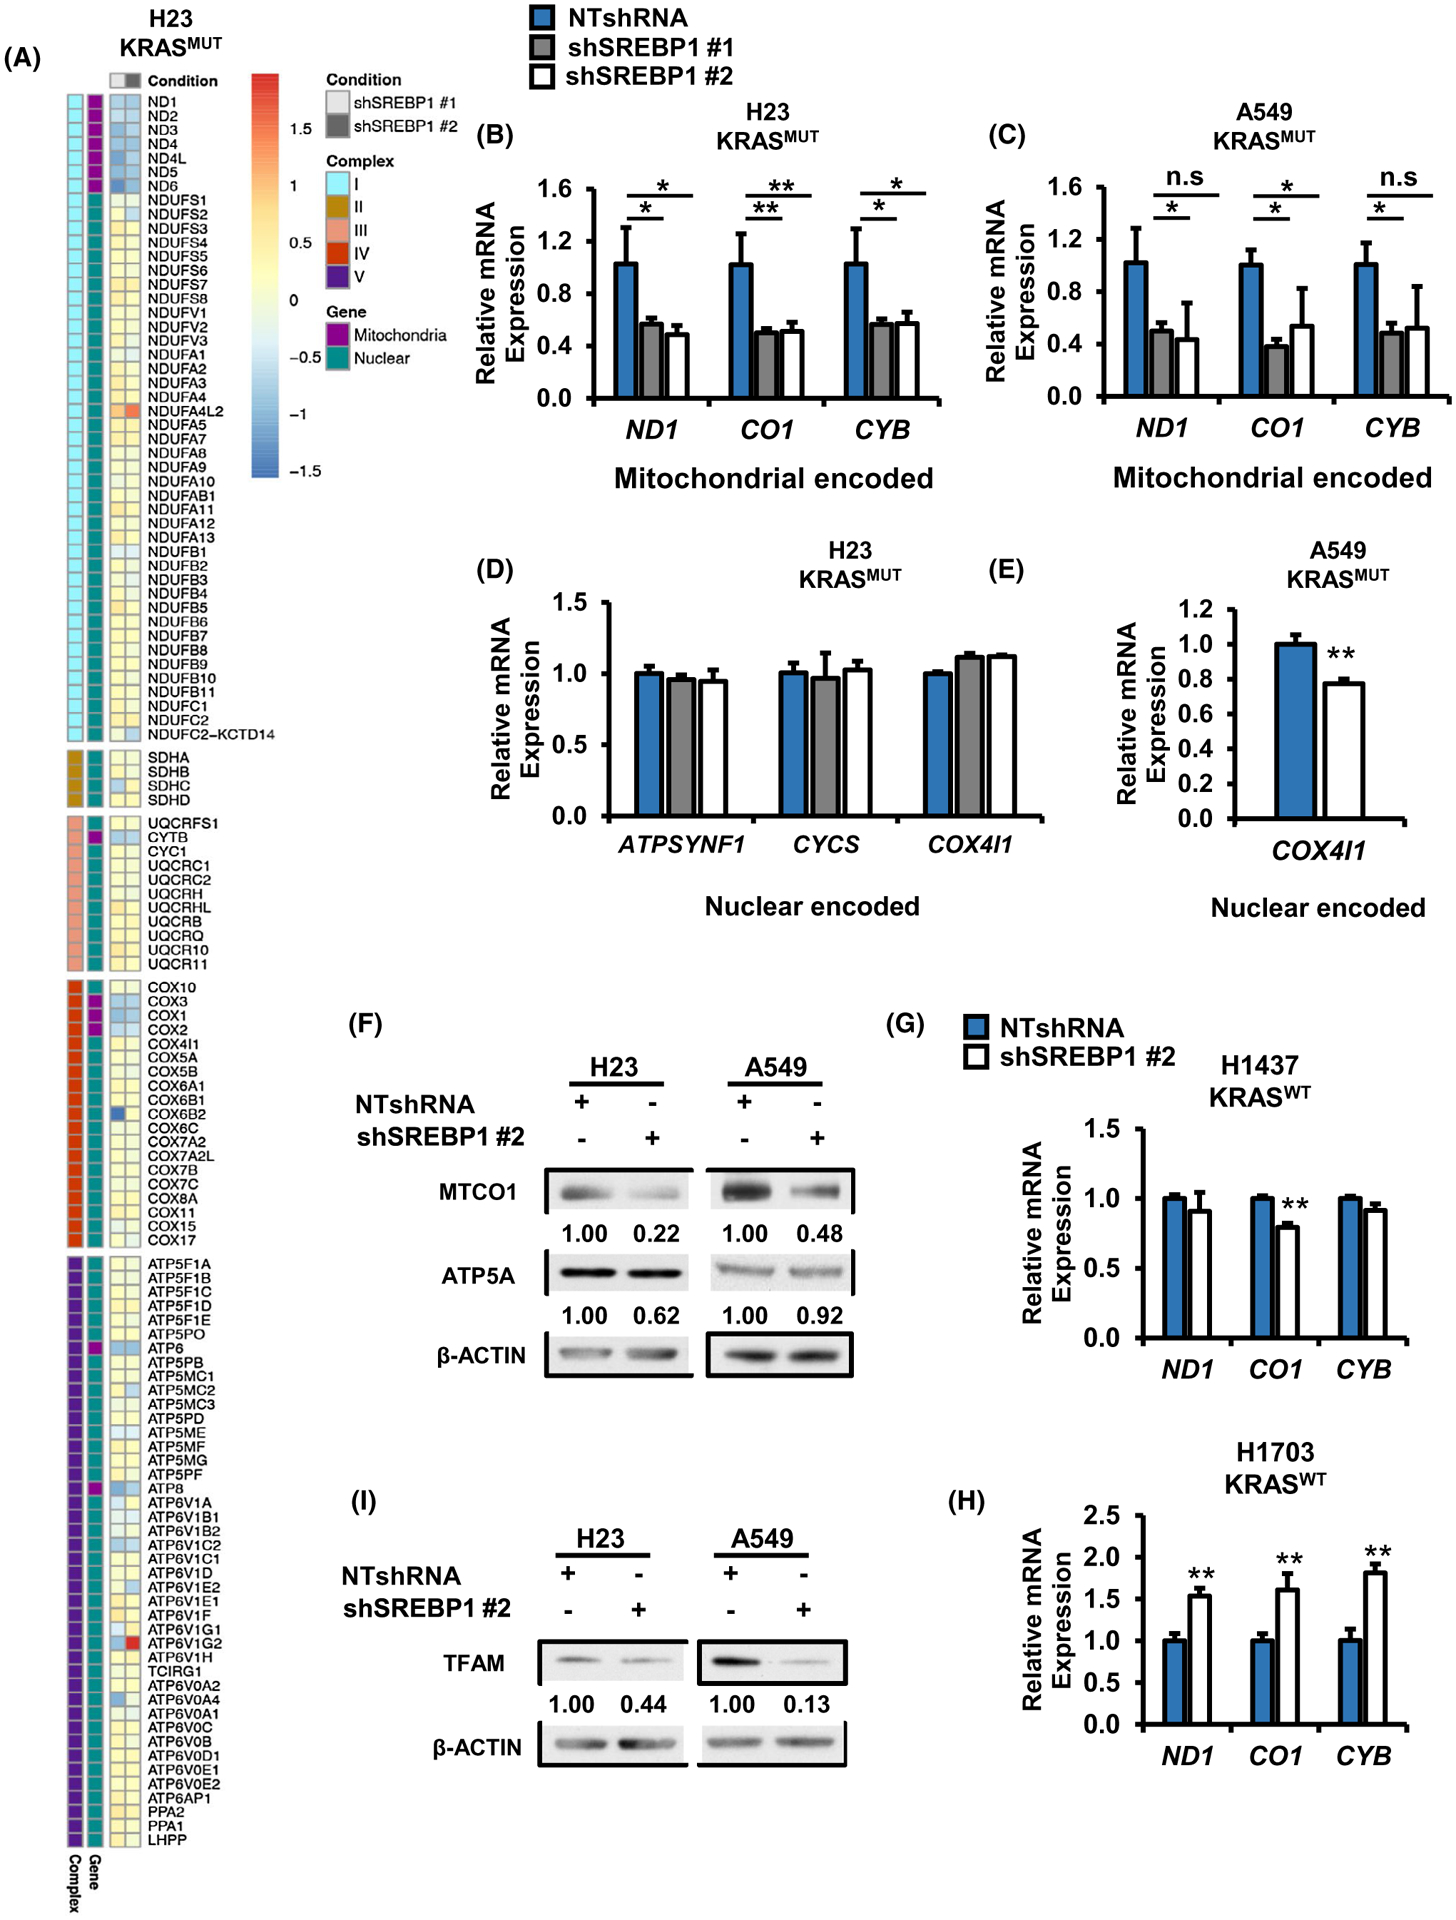
FIGURE 5.

Loss of SREBP1 decreases expression of mitochondrial encoded ETC genes in mutant KRAS NSCLC cells. A, RNA seq analysis for mitochondrial encoded and nuclear encoded mitochondrial proteins in H23 cells expressing either NTshRNA, shSREBP1 #1 or shSREBP1 #2. 122 genes matching the KEGG pathway for oxidative phosphorylation (hsa00190) were extracted from RNA seq data for H23 expressing NTshRNA or one of two shSREBP1s. Log2FC for shSREBP1 #1 and shSREBP1 #2 were plotted as a heat map and separated by ETC complex, with nuclear or mitochondrial encoded genes indicated by color. N = 3 per group. Heat map was generated using the R package pheatmap. Gene expression for mitochondrial encoded ETC genes in (B) H23, and (C) A549 cells expressing either NTshRNA shSREBP1 #1 or shSREBP1 #2. N = 3 per group. Bars indicate ± SD. *P < .05. Gene expression for nuclear encoded ETC genes in (D) H23 and (E) A549 cells expressing either NTshRNA or one of two different shSREBP1. N = 3 per group. Bars indicate ± SD. *P < .05. F, Protein expression for H23 (left) and A549 (right) cells expressing either NTshRNA or shSREBP1 #2. Proteins were analyzed via western blotting. and densitometry was performed using ImageJ. Gene expression for mitochondrial encoded genes in KRASWT (G) H1437 and (H) H1703 cells expressing either NTshRNA or shSREBP1 #2. N = 3 per group. Bars indicate ± SD. **P < .01. Protein expression for TFAM in H23 (left) and A549 (right) cells expressing NTshRNA or shSREBP1 #2. Proteins were analyzed via western blotting and densitometry was performed using ImageJ
