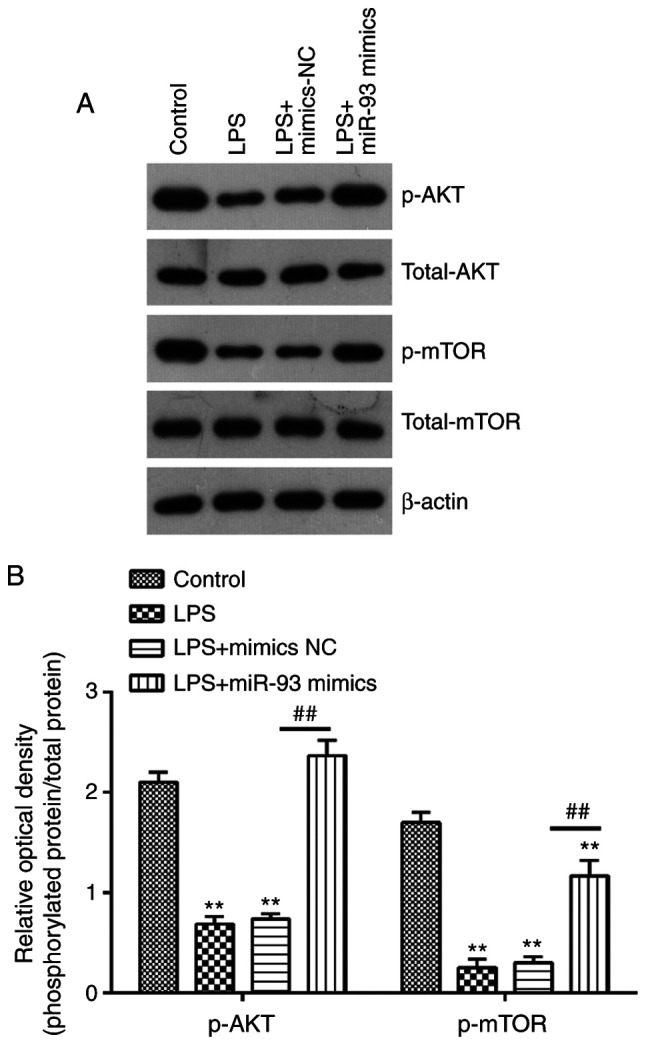
Figure 6.

miR-93 reactivates the AKT/mTOR pathway in an acute kidney injury cell model. (A) Protein expression of AKT, p-AKT, mTOR and p-mTOR were determined by western blotting. (B) The bands were semi-quantitatively analyzed using ImageJ software, p-protein was normalized to total protein. Data are presented as the mean ± standard deviation of three independent experiments. **P<0.01 vs. Control group; ##P<0.01 vs. LPS group. miR, microRNA; p-, phosphorylated; LPS, lipopolysaccharide; NC, negative control.
