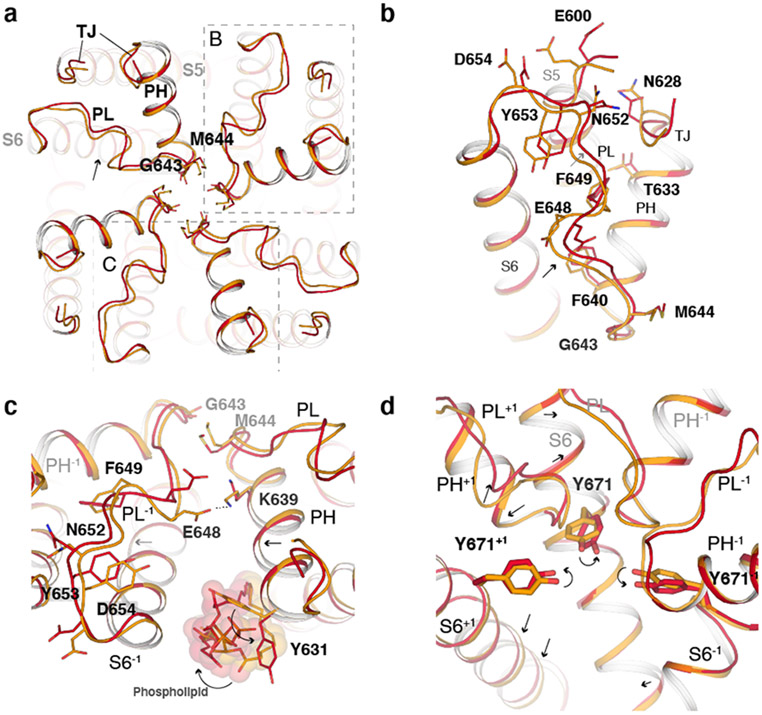
Fig. 4. Conformational changes in the outer pore during the second transition.
a, Extracellular view comparing the pore region in TRPV148C,CAP,INT (orange) and TRPV148C,CAP,OPEN (red). b, Close-up view of the outer pore. c, Close-up view of the pore loop and pore helix interface of adjacent subunits. Phospholipids are shown as spheres and sticks. d, Rearrangement of the interface between S6 and the outer pore, where +1 and −1 indicate features from neighboring subunits. Indicated residues are shown as sticks. Key regions abbreviated as turret junction (TJ), pore helix (PH) and pore loop (PL).

