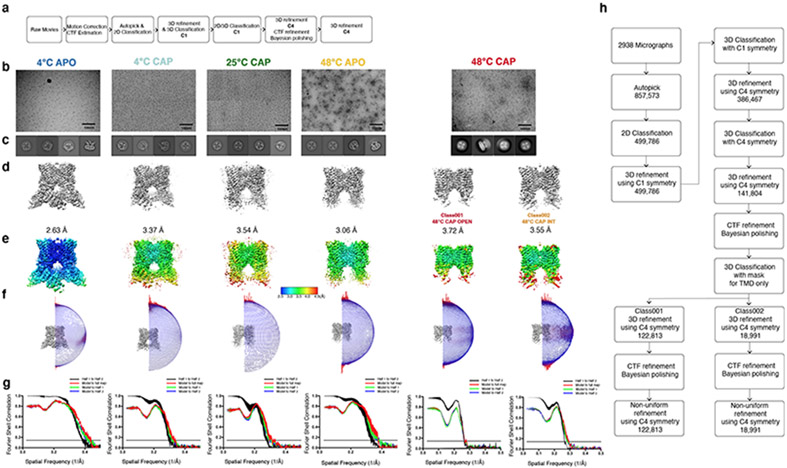
Extended Data Fig. 1. TRPV1 data collection and processing.
Data processing procedures, a, Data processing flow chart for TRPV14C,APO, TRPV14C,CAP, TRPV125C,CAP, TRPV148C,APO. b, representative micrographs, see Table 1 for details. c, 2D classification images, d, 3D reconstructions, e, local resolution estimation, f, the Euler distribution plot, g, FSC curves for TRPV14C,APO, TRPV14C,CAP, TRPV125C,CAP, TRPV148C,APO, TRPV148C,CAP,OPEN and TRPV148C,CAP,INT, respectively. h, Data processing flow chart for TRPV148C,CAP,INT and TRPV148C,CAP,OPEN.

