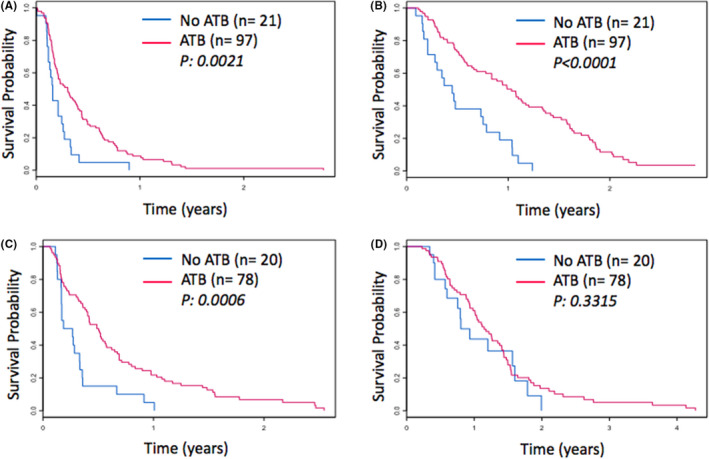
FIGURE 2.

Kaplan–Meier Survival Curves of subgroup analysis per chemotherapy type in metastatic PDAC cohort according to antibiotic use. PFS (A) and OS (B) for Gemcitabine‐ based chemotherapy group. PFS (C) and OS (D) for 5FU‐based chemotherapy group
