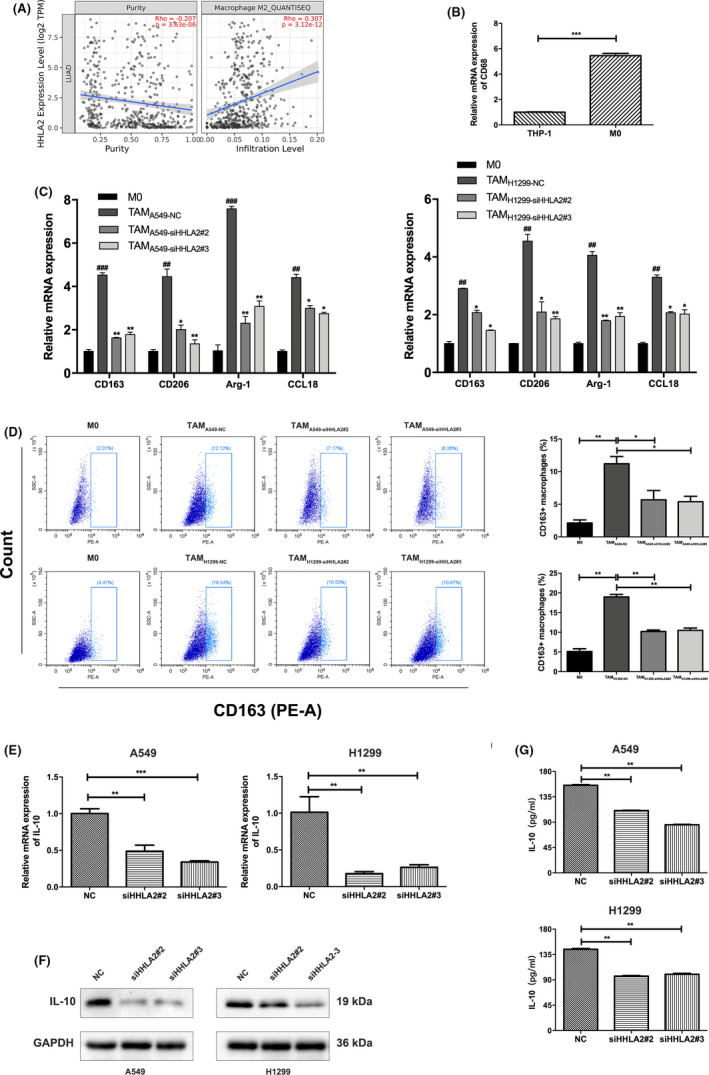
FIGURE 4.

Knockdown of HHLA2 in A549 and H1299 cells inhibited M2 polarization of THP‐1 macrophages. (A) TIMER database indicated a positive correlation between M2 macrophage infiltration and HHLA2 expression in lung adenocarcinoma. (B) CD68 was upregulated in M0 macrophages compared with THP‐1 cells. (C) M2 macrophage marker expression in M0 macrophages and co‐cultured TAMs. # means the significant difference between TAMA549‐NC/ TAMH1299‐NC and M0 macrophages. * means the significant difference between TAMA549‐siHHLA2/TAMH1299‐siHHLA2 and TAMA549‐NC/TAMH1299‐NC. (D) Flow cytometry revealed that knockdown of HHLA2 in A549 and H1299 cells decreased CD163+ macrophages. (E) IL‐10 mRNA levels in A549 and H1299 cells were transfected with NC or siHHLA2. (F) Protein levels of IL‐10 in A549 and H1299 cells were transfected with NC or siHHLA2. (G) The secretion of IL‐10 in the supernatant in A549 and H1299 cells was transfected with NC or siHHLA2. *p < 0.05, **p < 0.01, ***p < 0.001; ## p < 0.01, ### p < 0.001
