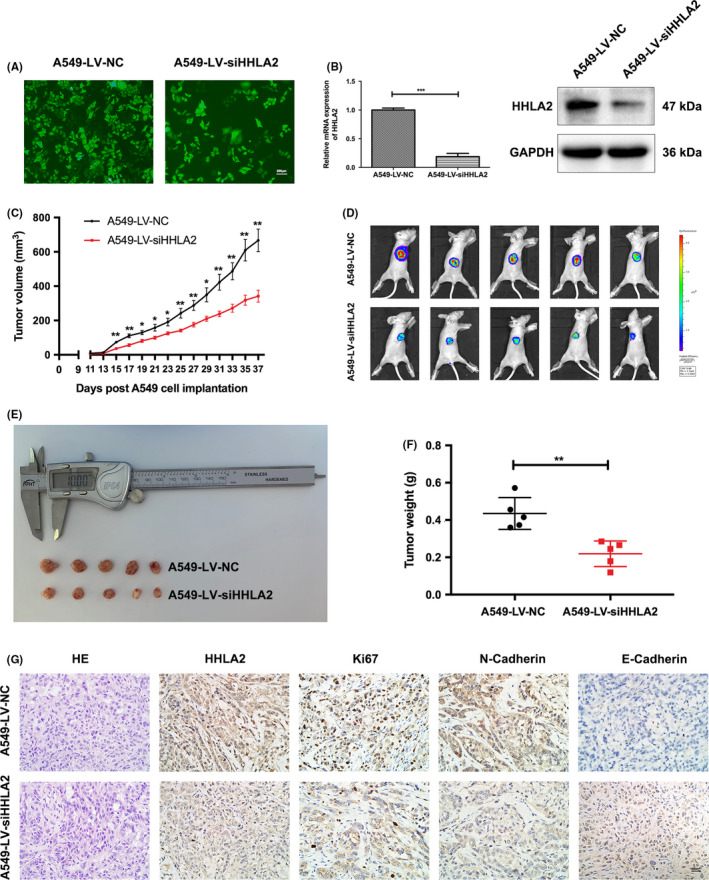
FIGURE 5.

Knockdown of HHLA2 inhibited tumorigenesis in vivo. (A) Representative fluorescence micrographs of A549 cells after transfected with LV‐NC and LV‐siHHLA2 labeled with GFP. Scale bar: 200 μm. (B) mRNA and protein levels of HHLA2 in the A549‐LV‐siHHLA2 group were significantly lower than those in the A549‐LV‐NC group. (C) Xenotransplantation tumor growth curve. (D‐F) Sizes and weight of tumor mass. (G) Representative immunohistochemistry staining micrographs of HHLA2, Ki67, N‐Cadherin, and E‐Cadherin in the xenograft tumors. Scale bar: 50 μm. *p < 0.05, **p < 0.01, ***p < 0.001
