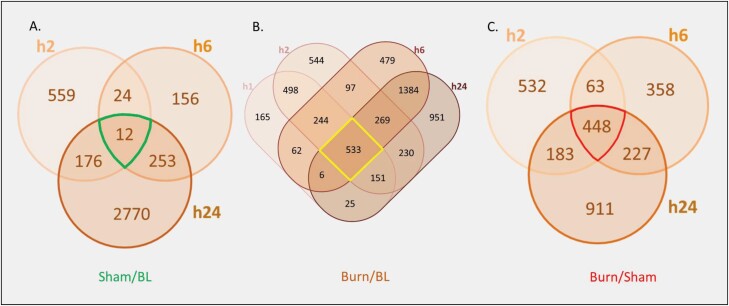
Figure 10.
Venn diagrams showing the distribution of significantly (P < .05, ppm < 2 and uniquely mapped to HMDB ID) modulated metabolites throughout the different time points. Metabolome results from skin biopsies of sham-treated animals (A) and burned animals (B) normalized to baseline, and burned animals normalized to levels from sham-treated animals at the same time point (C).

