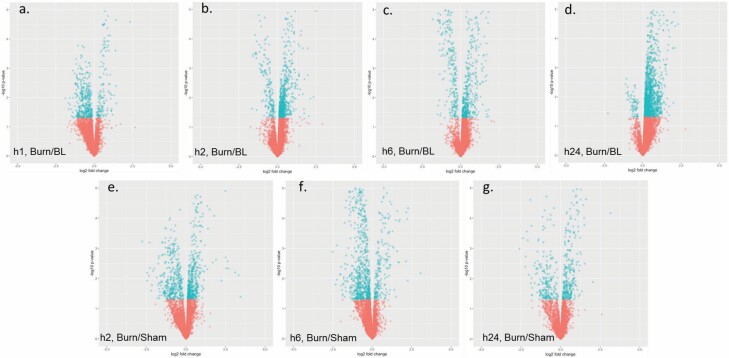
Figure 3.
Volcano plots illustrating quantitative modulations of the metabolome identified when comparing data of different groups and time points. Specifically, serum samples from burned mice euthanized at hour 1 (A), 2 (B), 6 (C), or 24 (D) were normalized to baseline (hour 0) and burned mice were compared to sham-treated controls from the same time point: 2 (E), 6 (F), or 24 (G) hours. Blue and red dots represent metabolites with P < or > .05, respectively.

