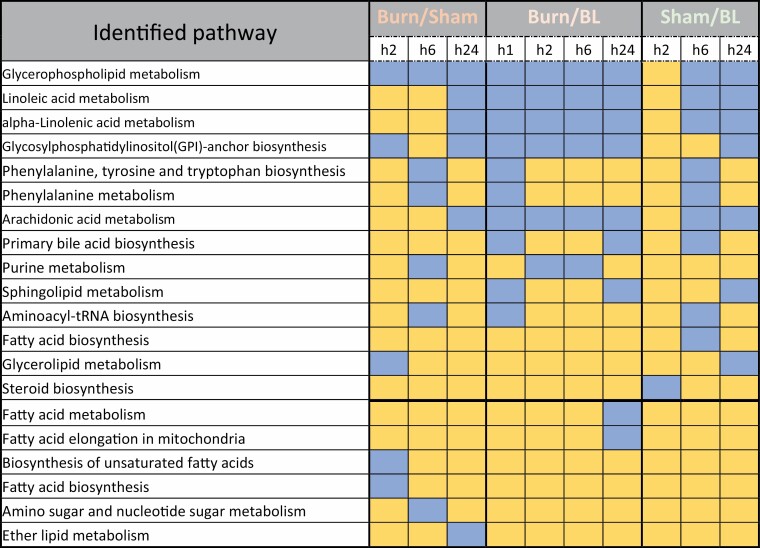
Figure 7.
List of pathways identified from the analysis of significantly (P < .05, ppm < 2 and uniquely mapped HMDB ID) modulated metabolites unique to each time point in sera of burned mice after normalization to metabolite levels in sham-treated mice (Burned/Sham), and in burned or sham-treated mice after normalization to metabolite levels in baseline sera (Burned/BL and Sham/BL). Blue color indicates a modulated pathway at the corresponding time point and yellow color indicates the absence of the pathway.

