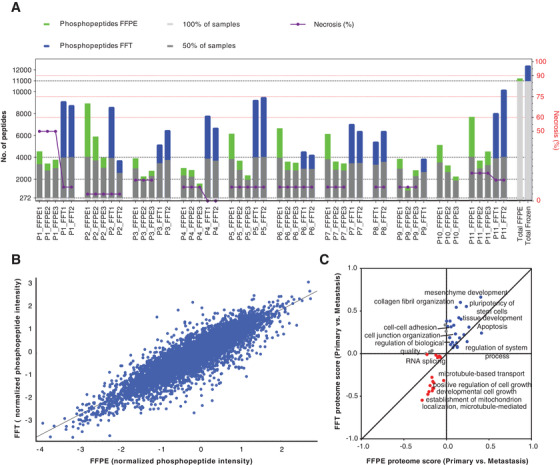
FIGURE 2.

Phosphoproteome analysis of FFPE and FFT tumor samples. (A) Bar graph representing the phosphopeptide coverage by patient and condition FFPE versus FFT. (B) Pearson correlation analysis between the FFPE and FFT samples based on median values of the normalized phosphopeptide abundances (phosphopeptide intensity/total protein intensity) (r = 0.89). (C) Comparison between FFPE and FFT conditions based on the enrichment analysis of biological pathways (BP) performed with the phosphopeptides fold changes (log2 ratios) between primary tumor and metastasis (primary/metastasis). Blue and red colors represent BP up‐ and downregulated in primary tumors (respectively), regardless of condition
