FIGURE 3.

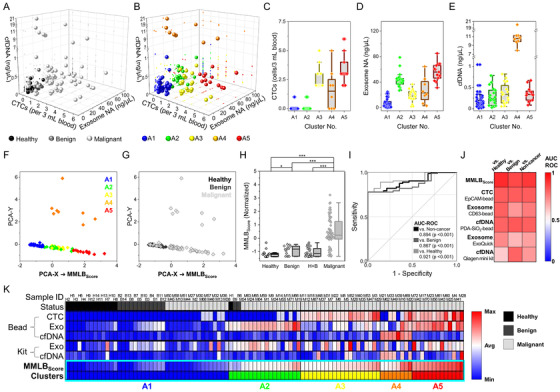
Machine learning‐based clustering of the three tumor biomarkers (CTCs, exosomes, and cfDNA) to establish MMLBScore and validate its diagnostic potential: (A) A 3D scatter plot demonstrating CTC count, exosome NA amount, and plasma cfDNA level of each patient depending on the status (malignant, benign, and healthy) of the cohorts. (B) A k‐means clustering of the cohorts based on the expression levels of the three tumor biomarkers. A total of 41, 18, 20, 8, and 13 samples were designated to each cluster, denoted as A1, A2, A3, A4, and A5, respectively. (C‐E) CTC count, exosome NA amount, and plasma cfDNA level for each cluster. (F) PCA applied to reduce the complexity of the 3D plot (CTCs, exosomes, and cfDNA) into the arbitrary 2D plot, with the x‐ and y‐axes consisted of two best linear approximations for stratifying the clusters. The x‐axis in the 2D scatterplot was determined as MMLBScore, which minimized the mean‐squared reconstruction error of the clusters and demonstrated a strong correlation with the status of the cohorts. (G and H) MMLBScore depending on the status of the cohorts. (I and J) The ROC curve and a heatmap of AUC‐ROC values demonstrating the enhanced diagnostic capability of MMLBScore compared to any of the single tumor biomarkers used in this study. (K) A heatmap showing expression levels of the three biomarkers compared to MMLBScore for each cohort
