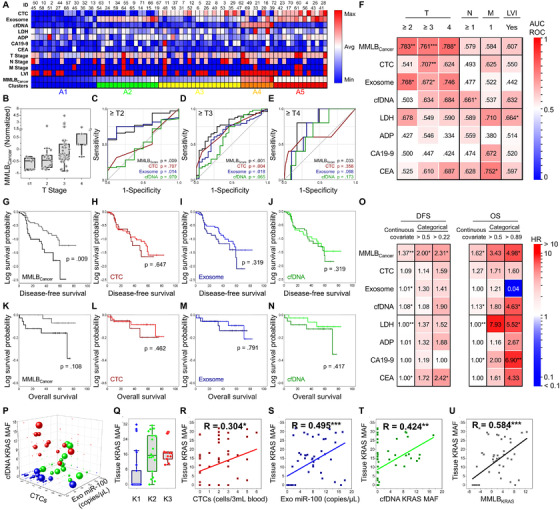
FIGURE 4.

MMLB analysis for determining the pathological features of a tumor, estimating the survival outcomes, and detecting KRAS mutation: (A) A heatmap representing MMLBCancer for each patient, along with their TNM stage, tumor biomarker expressions, and serum antigen expressions. (B) MMLBCancer for each patient depending on their T stage. (C‐E) ROC curves demonstrating the diagnostic capability of MMLBCancer (black), CTCs (red), exosomes (blue), and cfDNA (green) for differentiating advanced T stage patients. (F) A heatmap of AUC‐ROC values demonstrating the capability of MMLBCancer for differentiating patients depending on the pathological features of the tumor, including its size (T stage), the existence of nodal metastasis (N stage), the prevalence of distant metastasis (M stage), and LVI status. (G‐N) Kaplan–Meier survival analysis for (G‐J) DFS and (K‐N) OS between the patients with high (dark) and low (bright) MMLBCancer, CTC counts, exosome NA level, and cfDNA expressions. The median value for each biomarker (or score) was determined as a threshold for dividing the high versus low groups. (O) A heatmap of HR values demonstrating the prognostic capability of MMLBCancer was compared with the individual tumor biomarkers and serum antigens. (P‐U) The clinical capability of MMLB analysis to determine the tissue KRAS mutation. (P) A k‐means clustering of patients based on CTC counts, miR‐100 expression in exosomes, and the KRAS MAF in cfDNA. The size of the sphere is proportional to the fraction of KRAS mutant allele found in tissue. (Q) The KRAS MAF in tissue for each cluster. (R‐U) 2D scatterplots representing a correlation with the tissue KRAS MAF for MMLBKRAS and the single tumor biomarkers
